Accumulation Distribution Bitcoin Analysis and Accumulation/Distribution Signals
Created by Marc Chaikin
The BTC/USD indicator evaluates the net flow of investment into and out of Bitcoin.
Stock trading started the use of "volume." For stocks, volume means the count of shares bought and sold for a certain stock. It shows the cash flowing in and out of that stock.
The core idea of AD is that volume leads price changes in bitcoin. Volume comes before price shifts.
Tick volume is how much the bitcoin price changes (ticks) that a broker sees in a certain amount of time. Many brokers use tick volume in their charting tools.
Interpretation
This volume tool helps determine if volume goes up or down when the bitcoin price on a chart goes up or goes down.
UpBTCUSD Trend
When the chart shows an increase in Bitcoin price, the Accumulation/Distribution should concurrently rise. This indicates that the upward movement in Bitcoin's price is backed by volume, demonstrating strength and sustainability.
When Bitcoin's price moves upward but trading volumes fail to increase proportionally, the strength of the move weakens. This signals divergence between Bitcoin's price and its indicator, hinting at a potential reversal in trend direction.
DownBitcoin Trend
If bitcoin price drops, the AD line should drop too. This shows volume backs the fall with real push.
Conversely, if the Bitcoin price is declining while trading volumes remain flat, this indicates weakening momentum behind the move. This divergence between Bitcoin price and the AD (Average Directional Index) signals a potential reversal in market direction.
BTCUSD Analysis and Generating Signals
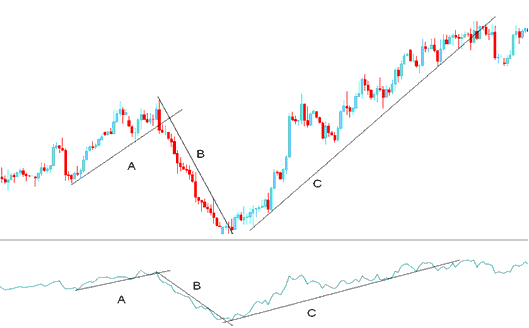
Illustrated Below is an example of a chart and the trading analysis explanation

From the chart above, we can divide the trading chart into three sections: part A, B, and C.
A - Upwards bitcoin trend line on the chart and also on the AD
B - Downwards bitcoin trend line on the chart & also on the AD
C - Upwards bitcoin trend line on the chart and also on the AD
As long as bitcoin's price and the indicator are both moving the same way, the price move still has enough momentum to keep going, like you see above.
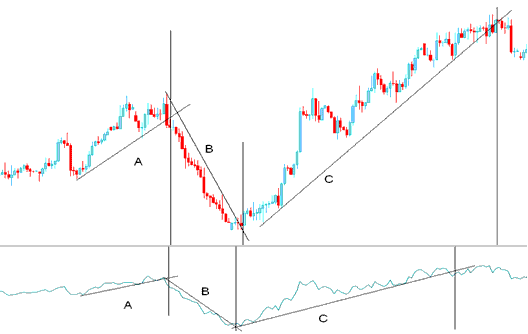
BTCUSD Trend-Line Break
The chart shows a break. Bitcoin trendline on AD snaps, then price follows.
Examining the chart hereafter, we have superimposed vertical partitions to denote the precise junctures where the bitcoin trend lines experienced a break, affecting both the bitcoin price graph and its associated indicator.
When you compare Bitcoin's trendlines on the indicator with actual price action, you'll notice the AD lines broke before the chart's did. That's because volume always leads price.

Trading Signals
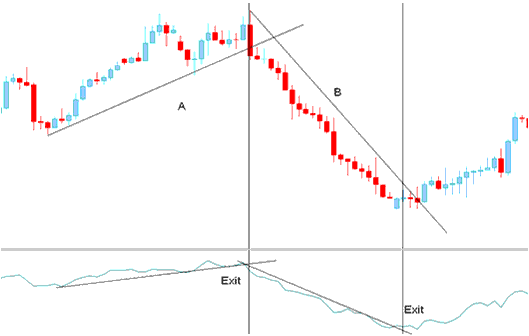
Exit
Exit signs are made and shown when the bitcoin trendline on the Accumulation/Distribution is broken. A bitcoin trendline break on the technical indicator tells you that things might change.

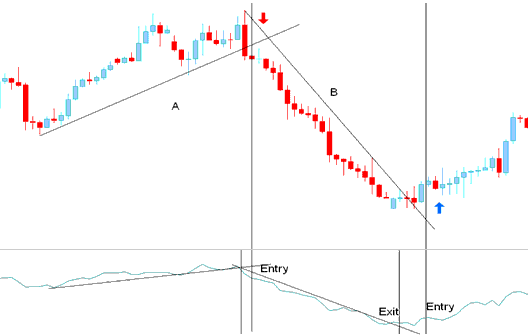
Entry
Breaking the bitcoin trend line on the AD indicator signifies a potential reversal in market price direction.
But if we plan to make a trade that goes the other way, it's a good idea to just relax and wait for something to be sure.
A complete confirmation happens when both the indicator and the price of bitcoin go past their bitcoin trendlines together.

Entry Signal Generated by Bitcoin Trend Reversal
More Topics and Guides:
- Trade BTC USD Interpret Hammer Candles Analysis
- Awesome Oscillator Technical BTC USD Indicator
- BTC USD Trade Equity Management Strategy
- How to Draw BTC USD Trade Fibonacci Extension Levels
- How to Analyze Different Types of BTC USD Candle Patterns Analysis
- How Do I Draw Fibo Extension Levels in Downwards Trend?
- Locating BTC USD Price Quotes Within the MetaTrader 4 Trading Application
- BTC USD Online Trade MT5 iPad App Guide Tutorial
- List of BTC USD Trade Setups used to Trade the BTC USD Market
- How to Set Take-Profit BTC USD Order on MT4 iPhone App
