Bilateral/Consolidation Chart Setups Trading
Bilateral or consolidation trading patterns can lead to price movements in either direction once they form. There are two primary types of such consolidation patterns visible on charts.
- Symmetric Triangles - Consolidation chart patterns
- Rectangles - Oscillating market
Symmetrical Triangle Patterns in Charts
Symmetrical triangle patterns use lines that meet to show a pause in price action. The buy spot comes on an upside break. A downside break signals a sell. Best case, the market breaks out before the triangle's tip. The move can go up or down from there.
Draw trend lines connecting the lows and highs in the consolidation of symmetrical triangle patterns. These lines slope evenly and meet at an apex. A price breakout often happens 60-80% into the triangle. Breakouts too early or too late tend to fail or whipsaw, making them less reliable. After the breakout, the apex acts as support or resistance. The price should not pull back past the apex. Use the apex as a stop loss zone for your positions.
When these patterns of holding steady happen, it means the market is pausing before it chooses which way the price will go next.
These patterns happen when buyers and sellers are fighting, and the market can't pick which way it wants to keep going.
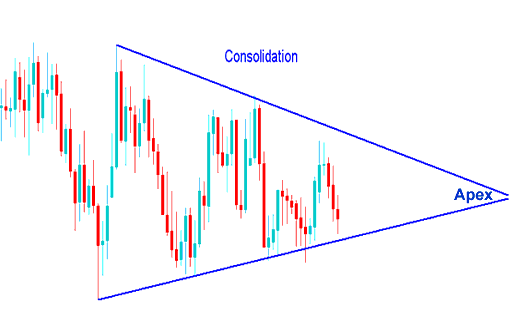
Forex Consolidation Pattern - Symmetrical Triangle Consolidation Chart Setup
But, this sideways chart pattern won't last forever: just like in tug of war, one side will eventually win. Looking at the chart below, notice how the pattern eventually broke out and moved in one direction. So, how do we ensure we're on the winning side of the trade?
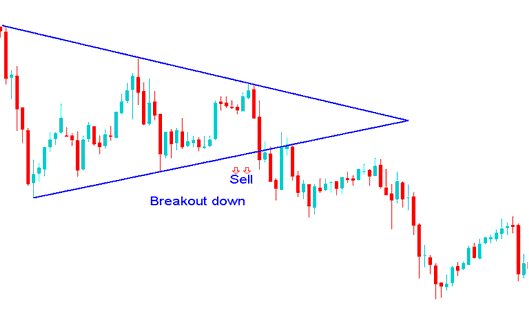
A Sell Signal Triggered by a Downward Price Breakout Following a Symmetric Triangle Consolidation Pattern
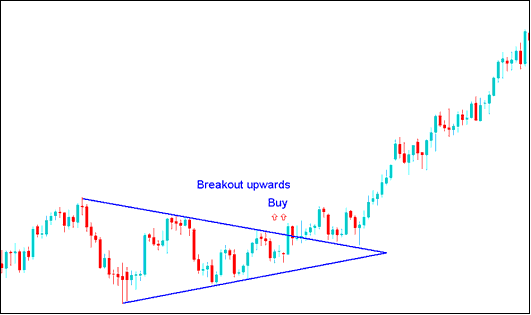
Break-out Up-ward Buy Trading Signal after Consolidation Chart Setup
Now back to our question, how do we make sure we are on the winning side of the trade breakout?
To execute trades effectively, wait for the price to break beyond one of the consolidation lines. Place buy orders if the price surpasses the upper line or sell orders if it breaks below the lower line, following the breakout direction.
If you prefer not to wait for the consolidation pattern to resolve, place pending orders as a forex trader. For details on pending orders, see the Stop Entry Order Types course.
The 2 types of pending stop order types used to trade consolidation patterns are:
- Buy Stop A pending order to open buy at a level that is above the market price.
- Sell Stop A pending order to open sell at a level that is below the market price.
These Orders are Set to Purchase If the Price Moves Above the Current Market Level or to Sell If the Price Drops Below the Current Market Level.
Rectangle Setup
A rectangle consolidation pattern is a range with narrow price action that develops and forms a consolidation period phase in market. The price range is defined by 2 parallel trend lines which are horizontal and indicate the presence of support & resistance levels. This rectangle pattern is drawn on a trading chart using a rectangle, henceforth the name rectangle chart pattern.
For this particular consolidation structure, the price action establishes several peaks and troughs that can be interconnected with parallel horizontal trend lines. This rectangular formation develops over a considerable stretch, thereby lending the consolidation pattern its characteristic box shape.
A breakout occurs when the price action breaks through either of the horizontal lines in the consolidation pattern, indicating a significant move. An upward breakout is interpreted as a buy signal, while a downward breakout suggests a sell signal.
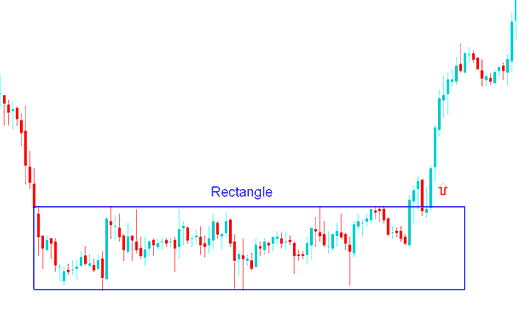
Rectangle Pattern Consolidation Pattern
Price escapes the range after a pause. It keeps climbing post-breakout in an up move.
More Courses:
- Gold Trend Reversal with Double Top Bollinger Strategy
- Zooming In, Out, and Navigating Step-by-Step in MetaTrader 4
- How to Use the Bollinger Bandwidth Indicator in MetaTrader 5
- Setting stop-loss orders using support and resistance levels
- How to Read the Accumulation/Distribution Indicator
- RSI Patterns: Trendlines, Support, and Resistance in Trading
- Which currencies actually get traded in the forex market?
- USDJPY Trading Hours: Market Opens and Closes
- How to Add Ichimoku Kinko Hyo on MT4 Lesson Tutorial
- Buy and sell signals from moving averages