Trading Stocks Read a Downwards Trend in Stocks
Downward Stocks Trend is when the prices on a stocks chart are moving lower & lower - meaning stocks prices generally close lower than where they opened in a downwards trend.
Trading Stocks Read a Downwards Trend in Stocks? - traders use the downwards stocks trend direction to generate sell signals and open sell stocks trades
How to Read Downwards Stocks Trend
Downward Stocks Trend - downward stocks trend drawn using a downward stocks trend line - How Do You Read Downward Stocks Trend Lines?
Read a Downwards Trend in Stock - How Do You Read a Downwards Trend on Stocks Charts
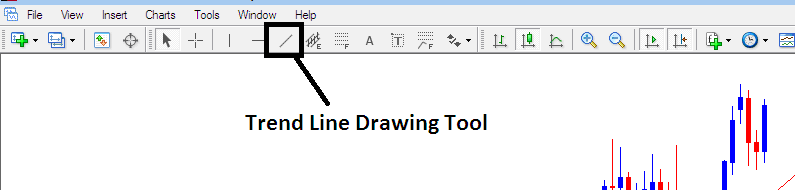
The MT4 stock platform provides chart drawing stocks trading tools for drawing stocks trend lines on MetaTrader 4 stocks charts. To draw a downward stocks trendline on a stocks chart - traders can use the trend line plotting stocks tool provided on the MT4 platform as is shown on the stocks examples illustrated & described below.
Read Downward Stocks Trend-Lines - How Do You Read a Downwards Trend on a Stocks Trading Chart?
To draw a downward stocks trend line on MetaTrader 4 software - select the MT4 stocks trendline plotting tool - then choose point A where you want to start drawing the downward stocks trend line and then point B where you want the downward stocks trend line to touch. You can also right-click on the downward stocks trend line & on the trend line properties option select the option to extend its ray by ticking the "ray check box" option in your stocks trading software.
Stocks trend trading is the most reliable stocks trading strategy used to trade stocks trading because once prices begin to move in a particular direction they can move in that particular direction for quite some time in what is known as a stocks trend.
Stock Downward Trendline Guidelines
Use stocks candle charts to draw stocks trend lines
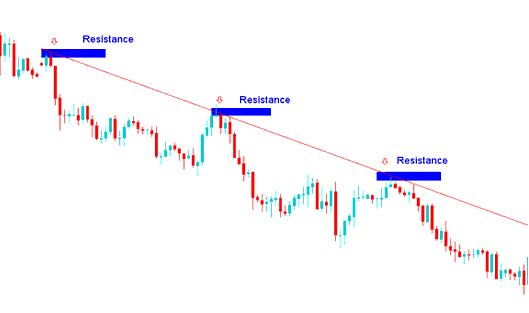
- The points used to plot are along the highs of the stocks price candlesticks in a downward trend. A downward trend move is defined by lower highs and lower lows in the stocks price.
- The points used to draw the trend lines are extremes points - these are - the high stocks price. These stocks price extremes are used because a stocks price close beyond these extreme points tells stocks traders that the stocks trend may be reversing. Traders will Read this is an exit stocks trade signal.
- The more often a downward trend line is tested by stocks price but it is not broken, then the more powerful the downward trend signal of this downward trend line is.
Read a Downwards Trend in Stock - How Do You Read a Downwards Trend on Stocks Charts


