How Do I Interpret Stocks Trading Divergence Stocks and Trade Divergence Setups in Stocks?
How Do You Analyze Stocks Trading Divergence Stocks and Trade Divergence Setups in Stocks?
Divergence Stocks Trading Definition - Divergence stocks is one of the stocks setups used by Stocks traders. Divergence stocks involves looking at a stocks chart and one more stocks indicator. For our divergence stocks example we shall use the MACD stocks trading technical indicator.
To spot this stocks divergence setup find two chart points at which stocks price makes a new swing high or a new swing low but the MACD indicator doesn't, indicating a stocks divergence between stocks price & momentum.
To look for divergence stocks signal we look for two chart points, 2 highs which form an M shape on the stock trading chart or two lows that form a WShape on the stock chart. Then look for same M-shape or W-Shape on the indicator that you use to stocks trade - for example RSI indicator, MACD indicator or Stochastic Oscillator indicator.
Example of a Stock Trading Divergence Trade Setup:
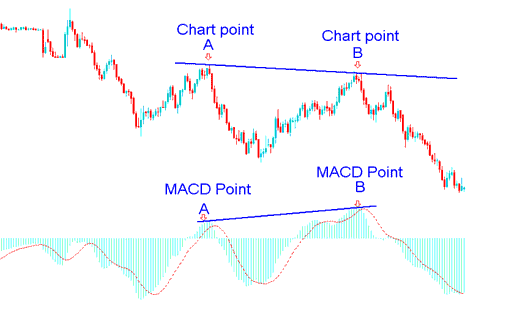
In the stock chart below we spot 2 chart points, point A & point B (swing highs). These 2 chart points form an M-shape on the stocks price chart.
Then using MACD technical indicator we check the highs made by the MACD technical indicator, these are highs that are directly below stocks trading Chart points A & B.
We then draw one line on the stock trading chart & another line on the MACD indicator.
Drawing Divergence Stocks Lines - Stocks Divergence Strategy - Stocks Trading Divergence Stocks Entry and Exit
The stocks chart above shows example of one of the four types of stocks divergence setup, the one above is known as hidden bearish stocks trading divergence. Types of stocks divergence setups are covered in the next learn stocks lesson.
Trading Stocks spot divergence stocks setup
In order to spot Stocks Trading divergence trading signal we look for following:
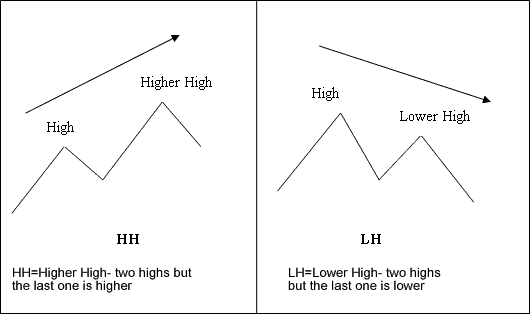
- HH - Higher High - 2 highs but the last one is higher
- LH - Lower High - 2 highs but the last one is lower
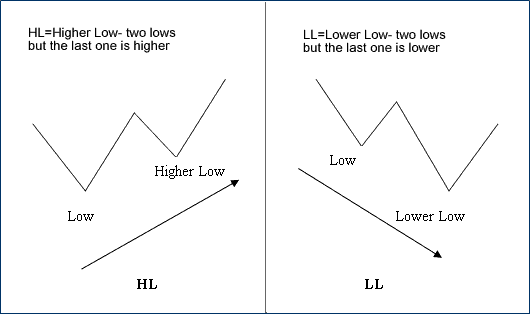
- HL - Higher Low - 2 lows but the last one is higher
- LL - Lower Low - 2 lows but the last one is lower
First let us look at the illustrations of these divergence stocks terms:
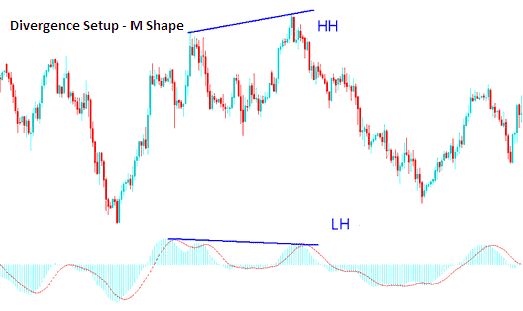
M shapes on Stocks charts dealing with Stock price Highs
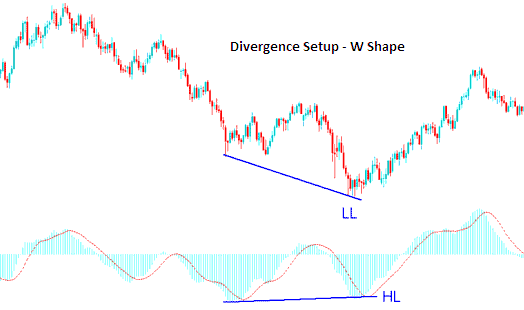
W Shapes on Stocks charts dealing with Stock price lows
Example of M Shapes on Stocks Charts
Examples of W Shapes on Stock Charts
Now that you have learned the divergence stocks terms that are used to explain divergence stocks set-up. Let us look at the two types of stocks divergences and how to stocks trade these stock trading divergence stocks chart setups.
The two stock divergence types which are:
- Classic Stocks Trading Divergence
- Hidden Stocks Trading Divergence
These two stocks divergence setups - classic trading divergence trading & hidden trading divergence trading are explained on the learn stocks tutorials in the stocks trading lessons tutorials on this learn stocks website located at the navigation menu under the topics learn stocks lessons.
How Do You Analyze Stocks Trading Divergence Stocks and Trade Divergence Setups in Stocks


