How Do I Analyze Trend Line Stocks Patterns used in Trend Stocks Analysis?
Trading Stocks Read Trend Line Stocks Patterns used in Trend Stocks Analysis
Stocks Example: Stocks Trend-Line Bounce - Trend Line Stock Patterns - Trend Stocks Trading
The stocks trend-line bounce pattern is a continuation stocks signal where the price bounces off the trend-line & continues in the same direction as that of the stocks trend.
Stocks Trendline Bounce Trendline Stock Patterns
- In an upward stocks trend, the stocks price will bounce upwards after hitting this upwards trendline level which is the support level.
Stocks Upward Trend - Stocks Trendline Bounce Pattern after Touching The Support Levels Provided by the Upwards Stocks Trend Line
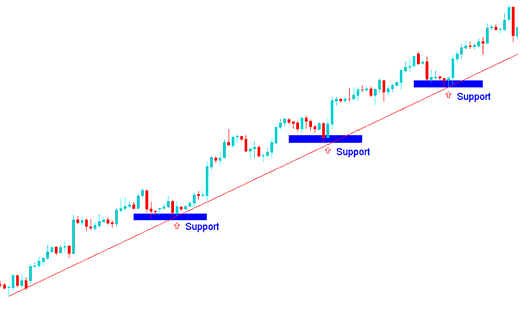
Upward Stocks Trend Line Bounce Trend Line Stocks Patterns
Stock Trendline Bounce Trendline Stock Patterns
- In a downward stocks trend, the stocks market will bounce downwards after hitting this stocks trendline level which is the resistance level.
Stocks Down Trend - Stocks Trendline Bounce Pattern after Touching The Resistance Levels Provided by the Downwards Stocks Trend Line
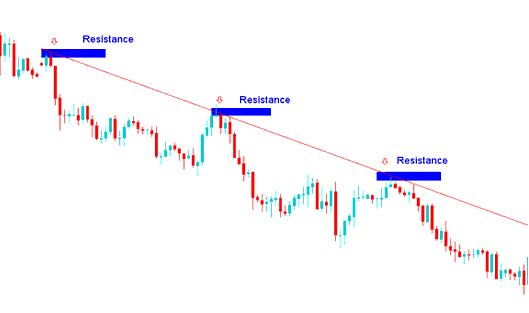
Downward Stocks Trend Line Bounce Trend Line Stocks Patterns
Example: Stocks Trendline Break - Trend Line Stock Patterns - Trend Stocks Trading
The stocks trendline break pattern is a stocks reversal trading signal where the stocks market goes through the trend line and starts moving in opposite direction.
Trend Line Break Trend Line Stocks Patterns
When a up stocks trend-line pattern is broken then the sentiment of the stock market reverses & becomes bearish
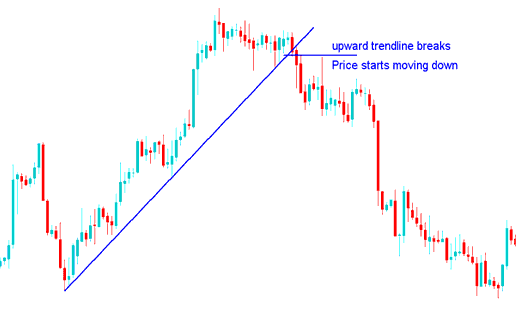
Upward Stocks Trend-Line Break Trend Line Stocks Patterns
Trend Line Break Trendline Stock Patterns
When a stocks down trend line pattern is broken then sentiment of the stocks reverses & becomes bullish
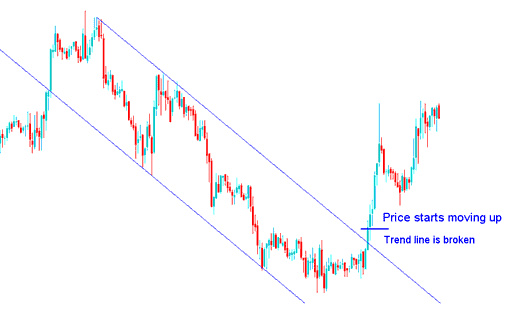
Downward Stocks Trend-Line Break Trend Line Stocks Patterns
NB: For very strong stocks trend patterns, after this stocks trendline break reversal stocks pattern, the stocks price will consolidate for some time before moving in the opposite trend direction. For short term stocks trends then this stocks trend line reversal stocks pattern will mean stocks price direction may reverse immediately.
How Do You Analyze Stocks Trend Line Patterns used in Trend Stocks Analysis?


