How Do I Draw Stocks Trend Lines Correctly on Stocks Charts?
Trading Stocks Read and Draw Stocks Trend Lines Correctly on Stocks Charts
Stocks Guide on How Do I Draw Stocks Trend Lines Correctly? - Detailed Guide on How Do I Draw Stocks Trend Lines Correctly
Principles of How Do I Draw Stocks Trend Lines Correctly?
Use stocks candle charts
- The points used to plot are along the lows of the stocks price bars in a bullish stocks market. An upward bullish stocks trend is defined by higher highs and higher lows.
- The points used to plot are along the highs of the stocks price bars in a bearish stocks market. A downward bearish stocks trend is defined by lower highs and lower lows.
- The points used to draw stocks trend lines are extremes points - the high or the low stocks price. These extremes are important because a close beyond the extreme tells stocks traders the trend of the stocks instrument might be changing. This is an entry or an exit stocks trade signal.
- The more often a stocks trend line is hit but not broken, the more powerful its stocks trend signal.
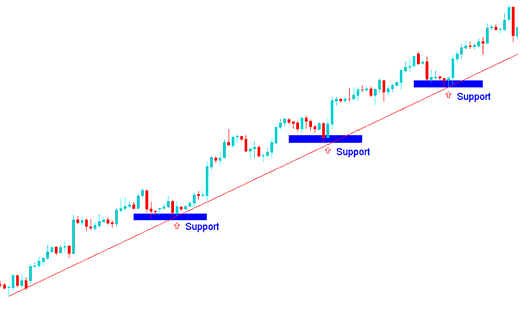
Stocks Trading Example 1: How Do I Draw Upward Stocks Trend Line Correctly?
To draw an upward stocks trend line correctly use two support points in a bullish upwards stocks trend so as to plot the upwards trend-line and then extend the trend-line as shown below. The upward stocks trend-line will show the general direction of stocks prices & as long as price is above this upward trend line then the upwards trend will remain intact - bullish upwards stocks trend.
If stocks prices move below the upward trend line which is the support level for the bullish upwards stocks trend then traders should close all their open stock trades - because this might be a stocks trend reversal signal. In an upward stocks trend stocks price should generally stay above support level which is marked by the upwards trend line.
How Do You Draw Stocks Trendlines Correctly for Upward Stocks Trend
How Do I Draw Upward Stocks Trend Line Correctly? - How Do I Draw Stocks Trend Lines Correctly
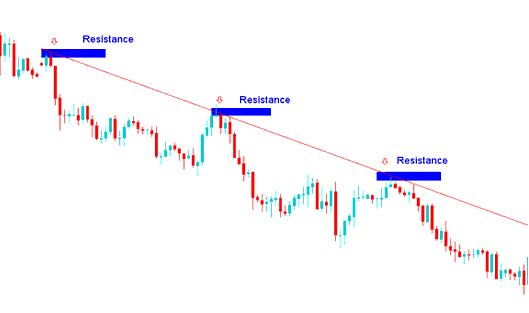
Stocks Trading Example 2: How Do You Draw Downward Stocks Trend Line Correctly?
To draw a downward stocks trend line correctly use two resistance points in a bearish downward stocks trend so as to plot the downward stocks trend line and then extend the trend line as shown below. Downward stocks trend-line will show the general direction of stocks prices and as long as price is below this downward trend line then the downward stocks trend will remain intact - bearish downwards stocks trend.
If stocks prices move above the downwards stocks trend line which is the resistance level for the bearish downwards stocks trend then traders should close all their open stock trades - because this might be a stocks trend reversal signal. In an downwards stocks trend stocks price should generally stay below the resistance area which is marked by the downward trend line.
How Do You Draw Stocks Trend Lines Correctly for Downward Stocks Trend
How Do You Draw Downwards Stocks Trend Line Correctly? - How Do I Draw Stocks Trend Lines Correctly
How Do You Draw Stocks Trend Lines Correctly on Stocks Charts?


