Indices Trends - Technical Analysis of Trend Trading
When it comes to trading the market, there is one saying that says "the trend is your friend". This is because the trend has been found to be the most reliable method of trading the markets as compared to any other technical analysis method. Traders should therefore aim to base their technical analysis on the market trend of the Indices that they are trading.
The Indices market is a great place for speculating on the short term market moves, more than it is for investing in the long term market trends. Traders can also follow and trade the long term trends but this website will mainly focus on day trading methods which are mainly short term trading methods.
For our examples & our trading we shall use the 1 hour chart time frame, the example below shows where to set the 1 hour chart on your Indices platform.
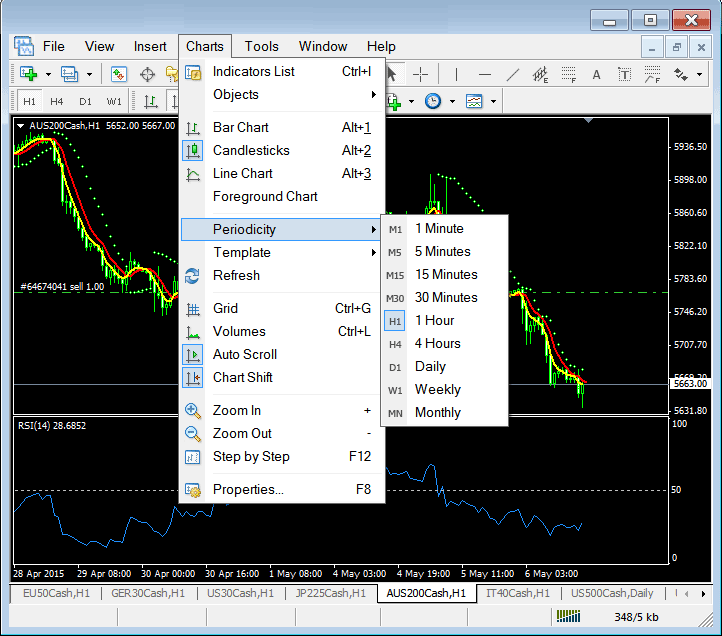
To access the 1 hour chart just click on chart menu as shown above then click periodicity and then choose the 1 hour chart time frame.
Once you have chosen the 1 hour chart time frame it is time to learn how to determine the trend of the Indices that you are trading, whether it is up or down so that you can decide whether to open a buy or a sell trade.
First let us look what is an uptrend & what is a down trend
Upward Trend
The upwards trend means the general market direction of a Indices is upward as is shown below - when the market trend is upward traders will open buy trades also known as "going long".
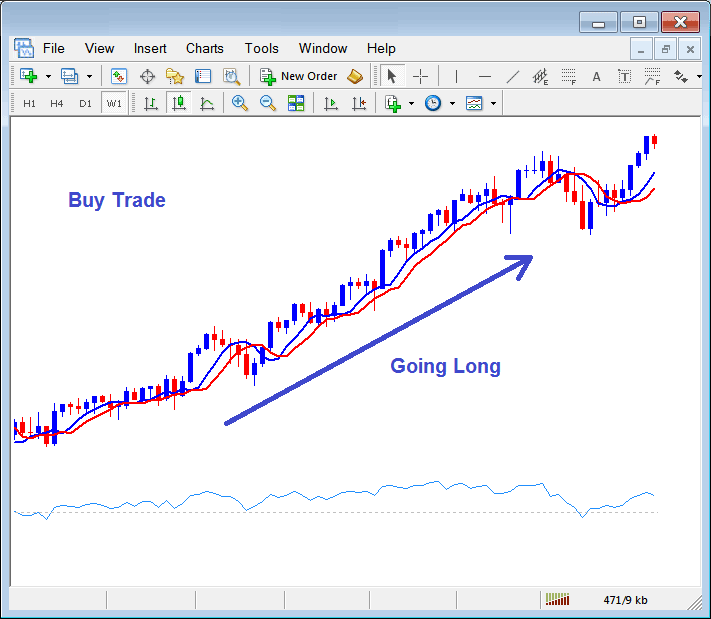
Upward Trend - Open Buy Trade or Going Long
Downward Trend
The downwards trend means the general market direction of a Indices is downward as is shown below - when the market trend is downward traders will open sell trades also known as "going short".
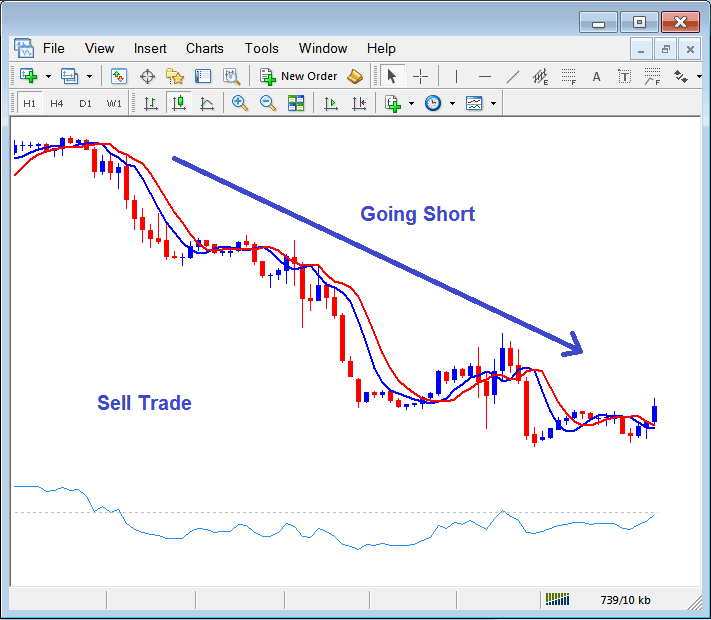
Downward Trend - Open Sell Trade or Going Short
Methods of Determining the Trend Direction
There are various methods used to determine the general market direction of a Indices.
One of the most common methods of determining the trend in any market is the use of trend lines. But for Indices the use of trend lines is not the best method therefore we shall not look at this method on this tutorial instead we shall look at the moving average crossover method which is the best method to determine the trend direction of Stock Indexes.
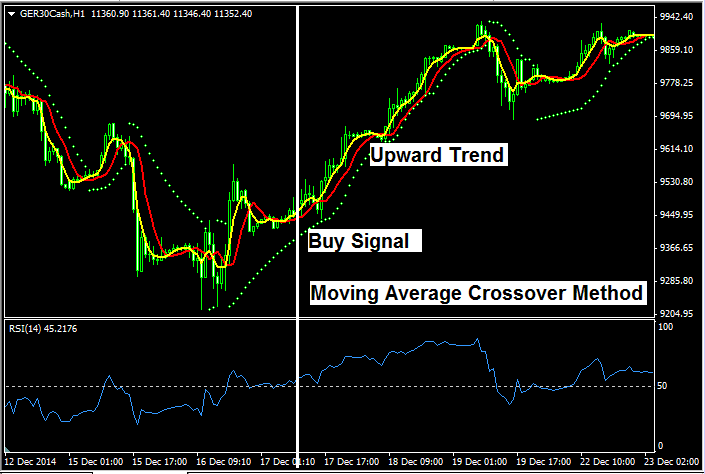
Moving Average Crossover Method - Index Trend Trading
The moving average crossover method is a trading method where two moving averages are used to determine the market direction. A buy or sell signal is generated when there is a crossover between these two moving averages. The buy signal is when the two moving averages are moving upward & a sell signal is when the two moving averages are moving downward.
Moving Averages - Buy Signal
The moving averages crossover method generates a buy signal when the two moving averages crossover & begin moving upward as is shown below, this is where a trader would have opened a buy trade as this upwards trend continued for some time after the buy signal was generated. A trader would have closed their trade once the moving averages crossed in the opposite direction.
The second indicator in the setup below was used to confirm this upwards trend - The RSI indicator levels above 50 shows prices are moving upward & closing higher than they open.
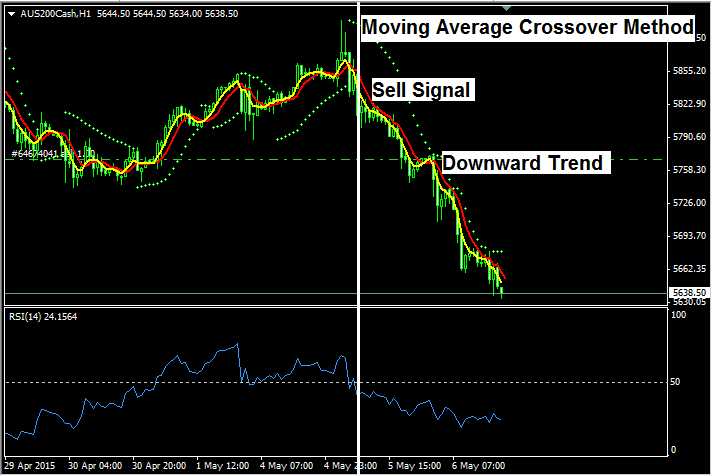
Moving Averages - Sell Signal
The Moving averages crossover method generated a sell signal once Moving averages crossed each other & started moving downward, the downwards trend continued moving down as shown and illustrated below by the moving averages which continued to move downward. A trader would wait until the moving averages cross in the opposite direction to close this sell trade.
The RSI indicator confirms the sell direction as long as the RSI is below 50 it shows prices are moving lower & closing lower than they opened.
Once you have learned how to determine the trend direction of the market then you can use this as the basis of your trading decisions when trading the online Indices market.


