
Money Management Methods – Tactics to manage your money while trading stock indexes.
Indices traders use two main ways to handle account funds.
The two money management trading strategies are:
1. Risk: Reward Ratio
2. Percent Risk Method
Risk: Reward Ratio
Risk-reward ratios guide trades for bigger wins. A 3:1 ratio means you risk one to gain three. Trade only when profits look three times the loss.
Stated differently, there is a higher likelihood of earning three times the amount risked on any given trade. For instance, risking $100 implies a potential profit expectation of $300 from that transaction.
Having a high risk : reward ratio will improve your chances of earning more profit when trading the market, e.g. even if your system win ratio is 50 % or even 30 %, you'll still make profits if you have a good risk: reward ratio just as is shown in the illustration:
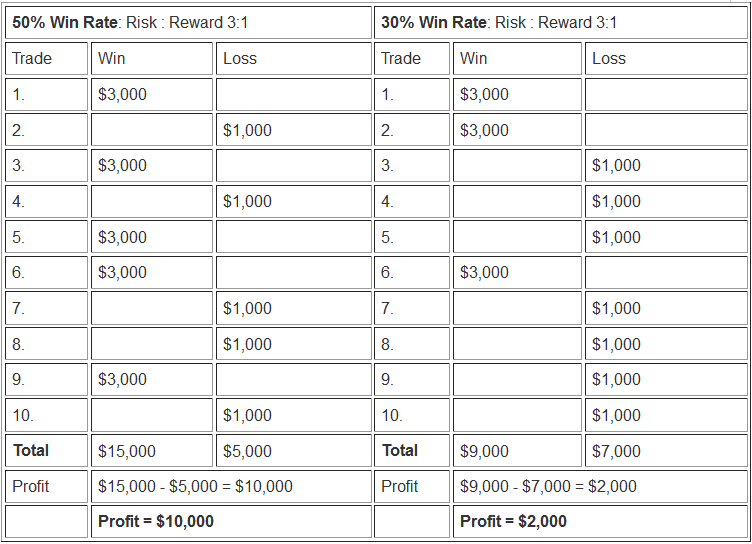
If your system wins half the time and your gains are three times your risk, ten trades would net you $10,000. Even if your system's win rate was just 30%, you would still earn $2,000 from the few trades that were successful, as shown earlier.
Percentage Risk Method
This method involves an indices trader assigning a fixed percentage as the risk allocation per trade position: for instance, a trader might elect to risk only 2% per transaction, thereby ensuring their overall trading exposure remains minimized consistently.
If a stock index trader has a $50,000 account, risk $1,000 per trade. Set the stop at that level based on your position.
For illustration:
If the trader opens is trading the Italy FTSE MIB 40 or IT 40Cash which has got a pip value of € 1 and one pip move is equal to 1 point then the trader would calculate the percent risk money management depending on the lots opened like as shown below
Example 1:
If the trader opens 1 Lot & 1 point move is equivalent to € 1 which is equal to $1.2, then the trader would calculate the points where to place and set a stop on their trade such as shown & displayed:
1 Lot equals € 1 per 1 pip move ($1.2)
$1,000/$1.2 (€ 1 is equal to $1.2) equals 833 points
One would set their stop 833 pips away
Example 2:
3 Lots equals € three per 1 pip move ($3.6)
If the trader opens 3 Lot and 1 point move is equal to € 3 which is equal to $3.6, then the trader would calculate the points where to place and set a stop on their trade such as shown & displayed:
$1,000/$3.6 (€ 3 is equivalent to $3.6) equals 277 points
One would set their stop 277 pips away
Example 3:
5 Lots equals € 5 per 1 pip move ($6)
If a trader opens five lots and each one-point move equals €5 or approximately $6, they should calculate positions carefully and place stop levels accordingly, as illustrated below.
$1,000/$6 (€ 5 is equal to $6) equals 166 points
One would set their stop 166 pips away
Example 4:
10 Lots equals € 10 per 1 pip move ($12)
If the trader opens 10 Lots & 1 point move is equal to € 10 which is equal to $12, then the trader would calculate the points where to place and set a stop on their trade such as shown:
$1,000 dollars/$12 (€ 10 is equivalent to $12) equals 83 points
One would set their stoploss 83 pips away
This also indicates that if a person opens fewer positions on lots and indices, they will have more room in pips to decide where to put their stop-loss orders. If someone trades one lot, they can set the stop-loss order up to 833 pips away and still only risk 2% of their money, but if they trade ten lots, they must set the stop-loss order only 83 points away to stick to the 2% risk rule.
Study More Guides and Topics:
- How to Set Up William Percent R Indicator on the MT4 Platform
- How to Place Gann Lines on Charts in MT4
- Creating Effective Trade Strategies: A How-To Guide
- FTSE Index Diagram Overview
- SGDJPY Market Opening and Closing Times
- Understanding Maximum FX Leverage and Used Leverage
- Gold Technical Indicator Analysis Through TTF