What is RSI Indicator? - Definition of RSI Indicator
RSI Forex indicator - RSI technical indicators is a popular forex technical indicator that can be found on the - Forex Indicators List on this website. RSI indicator is used by traders to forecast price movement based on the chart price analysis done using this RSI indicator. Traders can use the RSI buy and Sell Signals explained below to determine when to open a buy or sell trade when using this RSI indicator. By using RSI and other forex indicators combinations traders can learn how to make decisions about market entry and market exit.
What is RSI Indicator? RSI Technical Indicator
How Do You Combine Forex Indicators with RSI? - Adding RSI Indicator in MT4
Which Indicator is the Best to Combine with RSI?
Which is the best RSI Forex trading indicator combination for forex trading?
The most popular indicators combined with RSI are:
- Moving Averages Forex Trading Technical Indicator
- MACD
- Bollinger Band Indicator
- Stochastic Oscillator Indicator
- Ichimoku Kinko Hyo Indicator
- Parabolic SAR
Which is the best RSI indicator combination for Forex trading? - RSI MT4 indicators
What Indicators to Combine with RSI?
Find additional indicators in addition to RSI indicator that will determine the trend of the forex market as well as others that confirm the market trend. By combining forex indicators that determine trend & others that confirm the trend and combining these indicators with Forex RSI indicator a trader will come up with a RSI based trading system that they can test using a forex practice trading demo account on the MetaTrader 4 platform.
This RSI based trading system will also help traders to determine when there is a market reversal based on the indicators signals generated and therefore trades can know when to exit the market if they have open trades.
What is RSI Indicator Based Trading? Indicator based system to interpret price and provide trade signals.
What is the Best RSI Forex Strategy?
How to Select the Best RSI Forex Strategy
For traders researching on What is the best RSI forex strategy - the following learn forex trading tutorials will help traders on the steps required to guide them with coming up with the best strategy for trading forex market based on the RSI indicator trading system.
How to Create RSI Forex Systems - Best Forex Indicators Combination for RSI
- What is RSI Indicator Trading System
- Creating RSI Forex Trading System Template
- Writing RSI Forex Trading System Rules
- Generating RSI Forex Buy and RSI Sell Signals
- Creating RSI Indicator Forex Trading System Tips
About RSI Indicator Explained
Relative Strength Index RSI Technical Analysis and RSI Signals
Developed by J. Welles Wilder, explained in the book "New Concepts in Technical Trading Systems".
Relative Strength Index is the most popular indicator and it is a momentum oscillator and a trend following indicator. RSI compares a trading currency magnitude of the recent price gains against its magnitude of recent losses price losses & plots this data on a scale of values which ranges between 0-100.
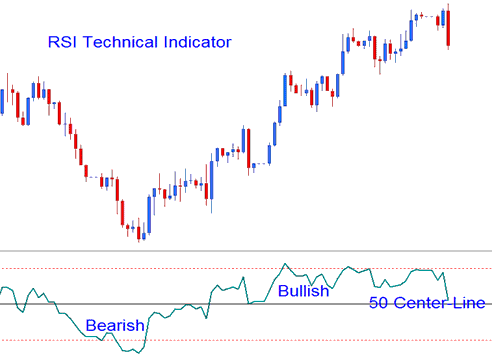
Relative Strength Index measures the momentum of a currency pair; values above 50 signify bullish momentum while values below 50 center-line signify bearish momentum.
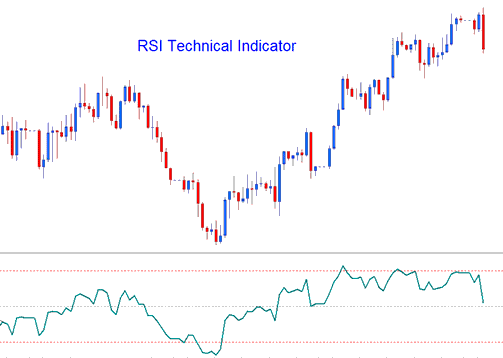
- RSI is plotted as a green line
- Horizontal dashed lines are plotted to identifying overbought and oversold levels are i.e. 70/30 levels respectively.
FX Technical Analysis & How to Generate Signals
There are several methods used to trade, these are:
50-level Crossover Signals
- Buy signal - when the indicator crosses above 50 a buy/bullish trading signal is given.
- Sell Signal - when the indicator crosses below 50 a sell/bearish signal is given.
RSI FX Trading Chart Patterns
Traders can draw trend lines and map out chart patterns on the RSI indicator. The Relative Strength Index often forms chart patterns such as head & shoulders chart pattern which might not have formed clearly on the price chart.
Forex Support/Resistance Breakouts
RSI is a leading indicator and can be used to predict Support/Resistance Breakouts before price breaks its support/resistance level. RSI uses the swing failure signal to predict when price is about to break support and resistance areas.
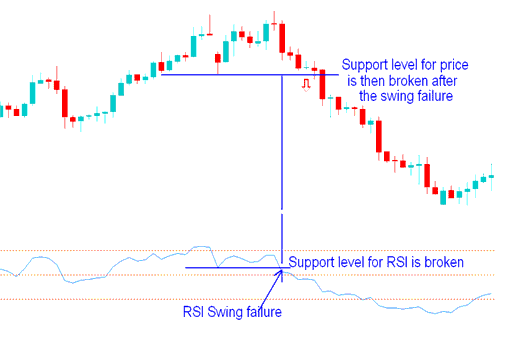
Swing Failure - Support & Resistance Break out
Overbought/Oversold Conditions on Indicator
- Overbought- levels above 80
- Oversold- levels below 20
These levels can be used to generate Forex signals such as when RSI turns up from below 20 after oversold, buy and sell when RSI crosses to below 80 after overbought, sell. These signals are not suitable for trading Forex because they are prone to a lot of whipsaws.
Forex Divergence FX Trading Setups
Divergence trading is one of the technical analysis method used to trade reversals of the price trends. There are 4 types of divergences that can be traded with this indicator covered in the divergence tutorial on this web site.


