Support and Resistance MT4 Indicator Signals
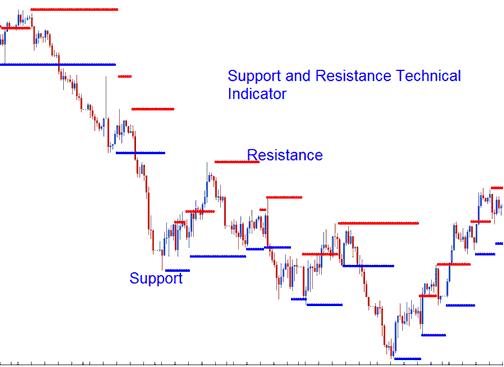
Support and Resistance is one of vastly used concepts in Forex. Most traders draw horizontal lines to show these levels.
There is also an indicator used to plot these levels automatically and indicate the resistance and support zones.

When it comes to these levels price can either bounce off these levels or break these levels.
If a resistance zone is broken price will move higher & the resistance level will turn to a support.
If a support level is broken price will move lower and this level will turn to a resistance.
Price where the majority of investors believe that the prices will move higher, while resistance levels indicate the price at which a majority of investors feel prices will move lower.
Once price has broken through a support or a resistance then it is likely that the price will continue heading in that particular direction until it reaches the next support or resistance zone.
The more often a support or resistance level is tested or is touched by price & bounces, the more major that particular level becomes.
MT4 Indicator and How to Generate Signals
These levels are calculated a trendlines method.
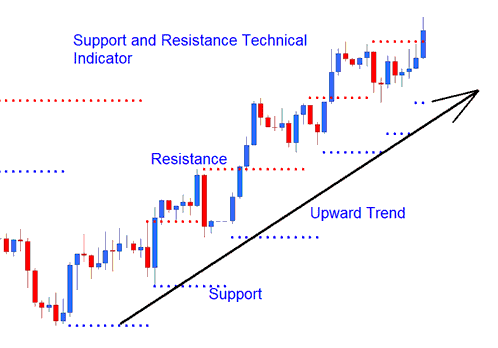
Upwards Trend
In an upwards trend the resistance & support will generally head upward

Upwards Trend
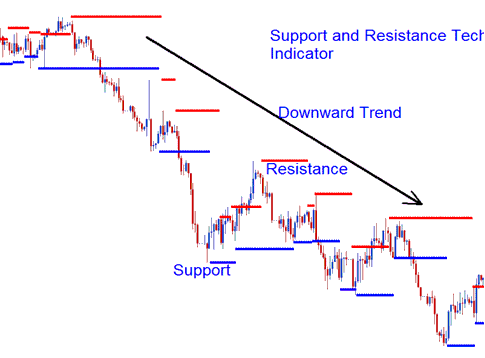
Downward Trend
In a downward trend the resistance & support will generally head downwards

Downward Trend
Get More Lessons and Tutorials:
- EURCHF Opening Time and EURCHF Closing Time
- What Leverage Should I Use to Trade 1 FX Mini Lot?
- Bollinger Bands Technical Indicator Settings in MetaTrader 4 Trading
- What is IBEX35 Indices in Index Trade?
- Gann Swing MetaTrader 4 Technical Indicator in Trading
- 1:300 Leverage illustrated
- Where is CAC in MetaTrader 4 Platform?
- Gold Platform MetaTrader 5 XAUUSD
- Transforming Your Gold Psychology and Mindset When
- MetaTrader NKY 225 Index NKY 225 MetaTrader 5 Forex Trading Platform


