MACD Analysis Buy & Sell Signals
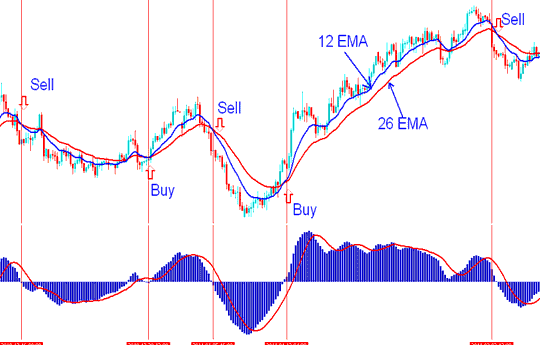
Since MACD uses 26 and 12 EMA to plot data, we will compare these EMAs with MACD to see how buy and sell signals are created.

MACD - Example illustration of MACD
The MACD is a leading indicator meaning it generates trading signals that are leading compared to price action as opposed to lagging indicators that lag behind the price.
Buy Trading
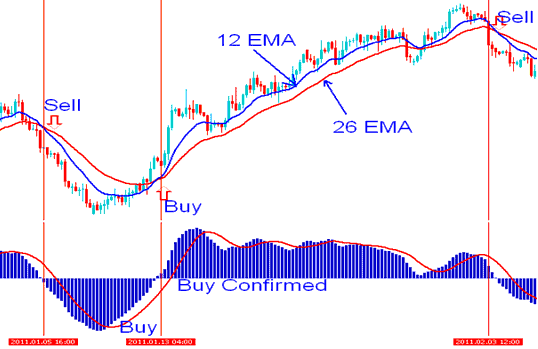
A buy signal is triggered when the MACD fast line crosses above the signal line. However, as with any leading indicator, these signals are susceptible to false readings or "whip-saws."
To successfully bypass misleading breakouts (whipsaws), prudence dictates awaiting a confirming signal for any buy or sell trade indication. A reliable confirmation signal materializes when both lines intersect above the zero mark: a generated buy signal under this condition is considered trustworthy.
In the visual example provided below, the MAs indicator generated a signal to buy assets just prior to the price starting its ascent. However, this buy signal wasn't definitively validated until the MACD moved above the zero line, coinciding with the Moving Averages (MAs) also indicating a crossover. Based on experience, it is generally preferable to initiate a purchase after both MACD lines have crossed above the central zero line mark.

Where to Buy using MACD - Buy Signal
Sell Trade
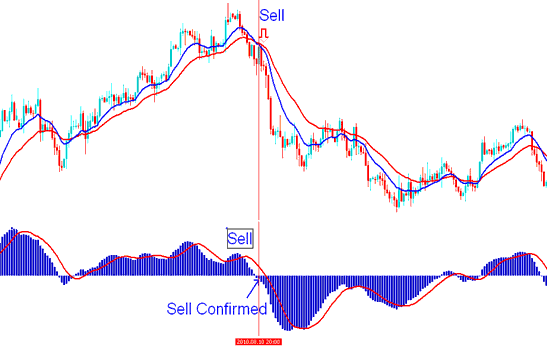
A sell signal pops up when the MACD fastline crosses below the signal line. But, just like buy signals, these can get caught in whipsaws or fakeouts.
To avoid false signals, wait for sell confirmation. It occurs when two lines cross below zero. That makes the sell signal strong.
In specific trading setups, Moving Averages suggest sell signals when synchronized with MACD crossing below the zero line and a crossover indication from Moving Averages simultaneously.

Where to Sell using MACD - Sell Signal
Learn More Lessons and Tutorials and Courses:
- Trading Indices with MACD Center Line Crossover Strategies
- Triple Exponential Moving Average (TEMA) – How It Works
- Piercing Line vs. Dark Cloud Cover candlestick patterns: what they mean
- Definition of Forex Pips and Example Illustrations of a Pip
- How Can I Analyze Forex Price Action in?
- Personalizing the Line Studies Toolbar Menu for FX Trading on the MT4 Platform
- Using the acceleration/deceleration indicator on MetaTrader 5 efficiently explained.
- Stochastic Momentum MT4 Platform Software
- Where is FTSE in MT5 Software?
- TRIX Forex Trading Robot EA – Automated
