How Do You Analyze Forex Price Action in Trading?
How Do You Trade Forex Price Action in Trading?
FX price action is analysis of price movements that are plotted/drawn on charts.
FX price action strategies involve using line studies and setups to identify and evaluate price trend directions on charts.
FX price action signals can also be used with forex systems, which can help decide which way to trade.
Pin Bar Price Action Trading Strategy
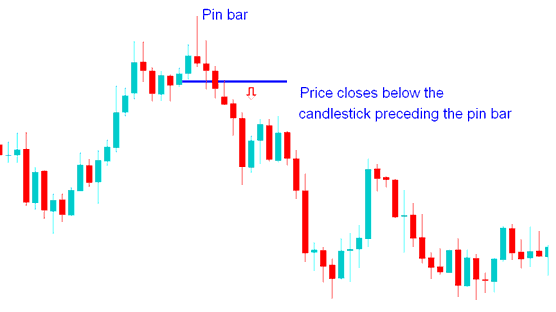
A pin bar is a distinctive price chart formation that signals a potential shift in the market's sentiment during the specific trading period it forms within.
This specific Pin Bar price action formation is characterized by an extended wick and a closing price situated close to its opening level. Its visual resemblance to a pin is the origin of its name, and it typically materializes following a significant advance or decline.
The trend reversal of this pin bar chart pattern is validated once the market closes below the candle that precedes this price action arrangement. Following the pin bar candlestick, the prices close below the blue candle, confirming the pin bar pattern reversal configuration.

FX Price Action 1.2.3 Technique in Forex
The Forex Price Action strategy involves trading the FX market relying exclusively on price charts, intentionally omitting the use of technical chart indicators. In this method of forex trading, candlestick charts are employed. This price action approach relies on charting lines and predefined price formations, such as the 1-2-3 price action pattern, which can materialize either as a singular setup or as a succession of price action sequences.
Forex traders favor price action strategies due to their unbiased nature. These methods focus solely on chart readings and price movements, offering straightforward market analysis without additional indicators.
Many traders employ this price action trading method: in fact, even traders who utilize technical indicators incorporate some element of price action into their trading approach.
Forex Price Action 1.2.3 Break Out Strategy
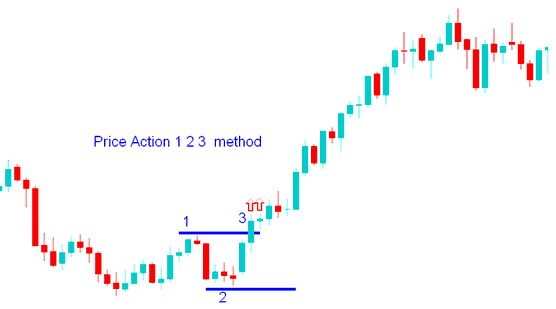
This price action approach uses three points on the chart to spot breakouts in Forex pairs. The 1-2-3 method takes a peak and a trough as points 1 and 2. A move above the peak signals a buy. A drop below the trough signals a sell. The breakout from point 1 or 2 creates point 3.

Forex Price Action 1.2.3 Break Out Strategy Example
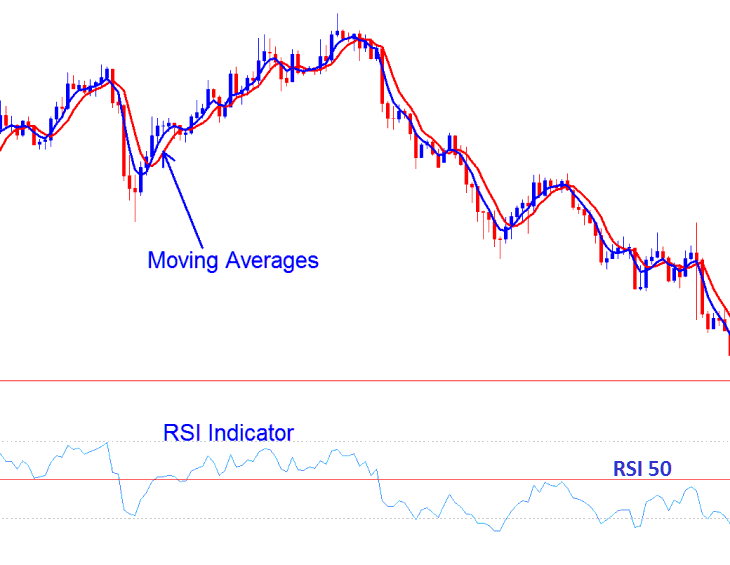
RSI & Moving Averages
Good indicators to combine price action setups with are:
- RSI Indicator
- Moving Average Indicator
Forex traders should use these two indicators to check if the price is breaking out in the same direction as the trend, as shown by these two chart indicators. If the direction is the same as the direction of these indicators, then traders can make a trade in the direction of the signal. If not, traders should not make a trade because the signal is more likely to be a forex whipsaw.
Like other Forex indicators, price action can produce false signals. Use it alongside other signs rather than alone for best results.

Combining Together Price Action Trading Strategy other Indicators
How Do You Analyze/Interpret Forex Price Action in Trading?
Get More Courses and Topics:
- Strategies for Trading NETH25 Indices
- Stop Loss Settings for XAU/USD Orders
- MQL5 Automated Forex Trade Robots: Skilled Helper CodeBase
- AUD vs CAD Exchange Chart
- How to Set Up and Open XAU/USD Trades in MT4 Platform Step by Step
- When Trading XAU/USD, What is the Best Leverage for $1000?
- SX 50 Pips Value Explanation

