How to Add Linear Regression Slope Indicator on MetaTrader 4 Charts
Step 1: Open Navigator Window on Forex Trading Platform
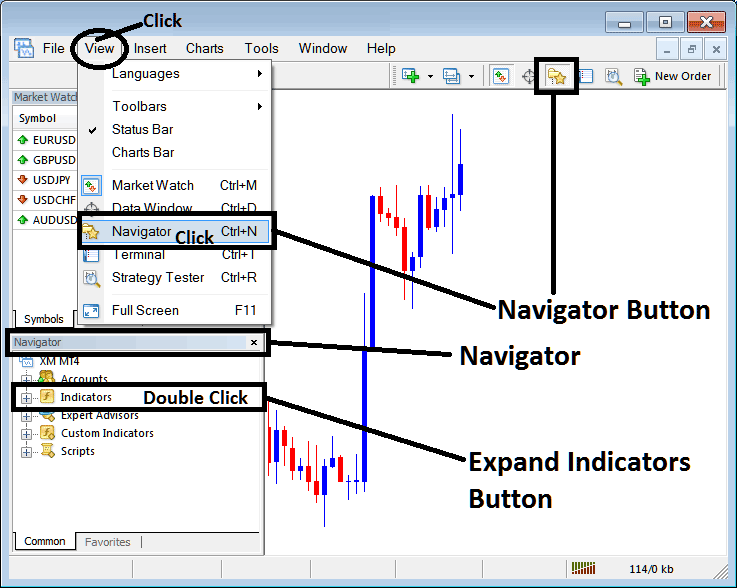
Open Navigator window as shown & illustrated below: Go to 'View' menu (click on it), then select 'Navigator' window (click), or From Standard Tool Bar click the 'Navigator' button or press keyboard short cut keys 'Ctrl+N'
On Navigator window, choose 'Indicators', (Double-Click)
How to Add Linear Regression Slope Indicator on MetaTrader 4 - MT4 Linear Regression Slope Indicator
Step 2: Expand the Indicators Menu on the Navigator - Adding Linear Regression Slope MT4 Indicator
Expand the menu by clicking the expand button marker (+) or double click the 'indicators' menu, after this the button will appear as (-) and will now display a list as shown below - select the Linear Regression Slope forex chart indicator from this list of forex indicators so as to add the Linear Regression Slope indicator on the forex chart.
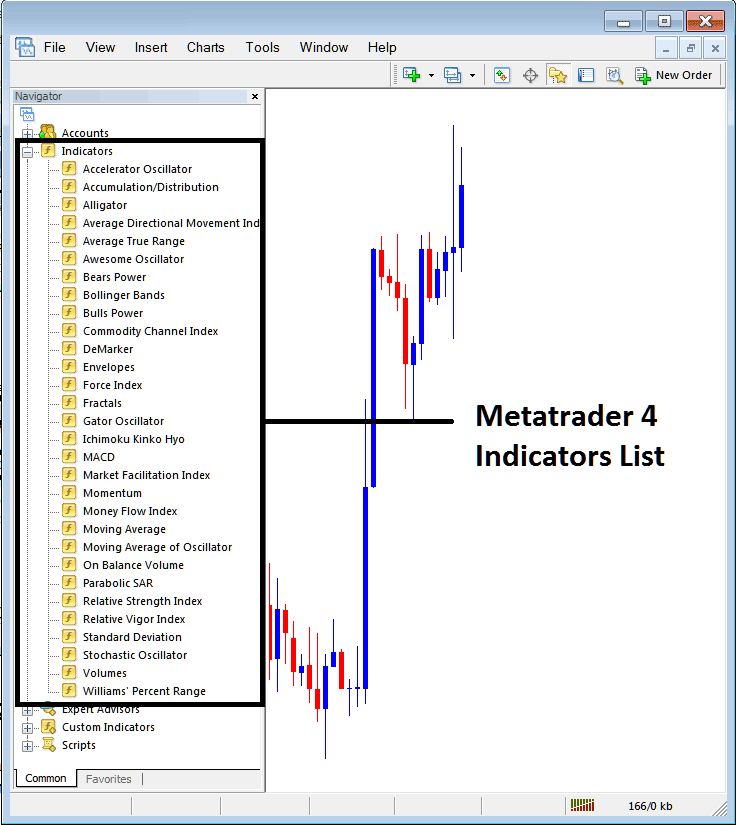
How to Add Linear Regression Slope Indicator - From the Above window you can then place Linear Regression Slope indicator that you want on the Forex chart
How to Add Custom Linear Regression Slope Indicator to MT4
If the technical indicator you want to add is a custom indicator - for example if the Linear Regression Slope technical indicator you want to add is a custom indicator you will need to first add this custom Linear Regression Slope indicator on the MT4 platform & then compile custom Linear Regression Slope indicator so that the newly added Linear Regression Slope custom indicator pops up on the list of custom indicators in MetaTrader 4 software.
To learn how to install Linear Regression Slope indicators on MT4, how to add Linear Regression Slope indicator window to MT4 and how to add Linear Regression Slope custom indicator in MT4 - How to add a custom Linear Regression Slope indicator in MT4.
About Linear Regression Slope Technical Indicator Explained
Linear Regression Slope Forex Technical Analysis Signals
Linear Regression Slope indicator calculates the slope/gradient value of regression lines which involves the current price bar & the previous n-1 price bar (where n = regression periods)
This Indicator calculates this value and updates it for each price candlestick loaded in the price chart.
The Indicator is calculated from the Linear Regression Indicator. The linear regression plots the trend of the price chart over a specified duration of time and this market trend is determined by plotting a Linear Regression Trend Line using the "least squares fit" method. The slope of this trend line is then calculated and this forms the linear regression.
Linear Regression Slope
The slope values are then smoothed by multiplying the raw slope indicator values by 100 and then dividing this value by the price
Linear Slope Regression = (raw value of slope * 100 / price).
The smoothing of the slope values is essential when comparing markets that are volatile & trade within wide price ranges for each price candle. Smoothed slope value will show the percent change in the price per every candle used to calculate the regression (best fit) line.
FX Technical Analysis & Generating Signals
- If the smoothing of the slope is 0.30, then the regression line is rising and adjusting at a rate of 0.30% for every candle.
- If the smoothing of the slope of -0.30, then the regression line is going down & adjusting at a rate of -0.30% for every candle.
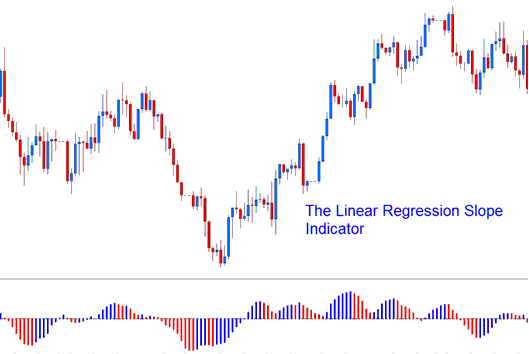
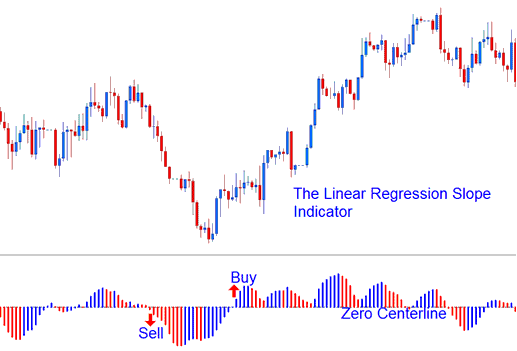
The regression slope is displayed as a bi-color histogram that oscillates above and below zero center line. Center-line that's used to generate Forex trading signals is set at the 0 level.
- A rising slope (greater than the previous value of 1 candle ago) is displayed in the Blue/Upward Slope color,
- A declining slope (lower than the previous value of 1 candle ago) is displayed in the Red/Downward Slope color.
Technical Analysis in FX Trading


