How to Add Bears Power Indicator on MetaTrader 4 Charts
Step 1: Open Navigator Window Panel on Forex Trading Platform
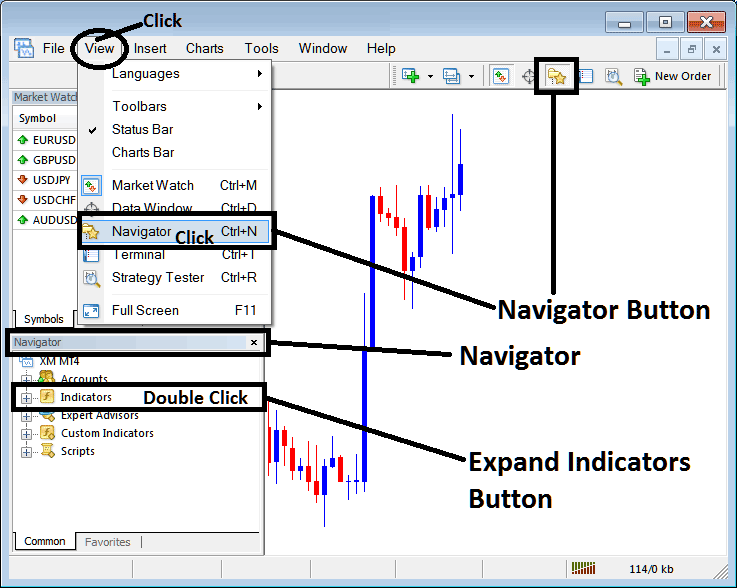
Open Navigator window as shown & illustrated below: Go to "View" menu (click on it), then select "Navigator" window (click), or From Standard Tool Bar click the "Navigator" button or press keyboard short cut keys "Ctrl+N"
On Navigator window, select 'Technical Indicators', (DoubleClick)
How to Add Bears Power Indicator on MetaTrader 4 - MT4 Bears Power Technical Indicator
Step 2: Expand the Indicators Menu on the Navigator - Adding Bears Power MT4 Indicator
Expand the menu by clicking the expand button marker (+) or double click the "indicators" menu, after this the button will appear as (-) and will now display a list as shown below - select the Bears Power forex chart indicator from this list of forex indicators so as to add the Bears Power indicator on the forex chart.
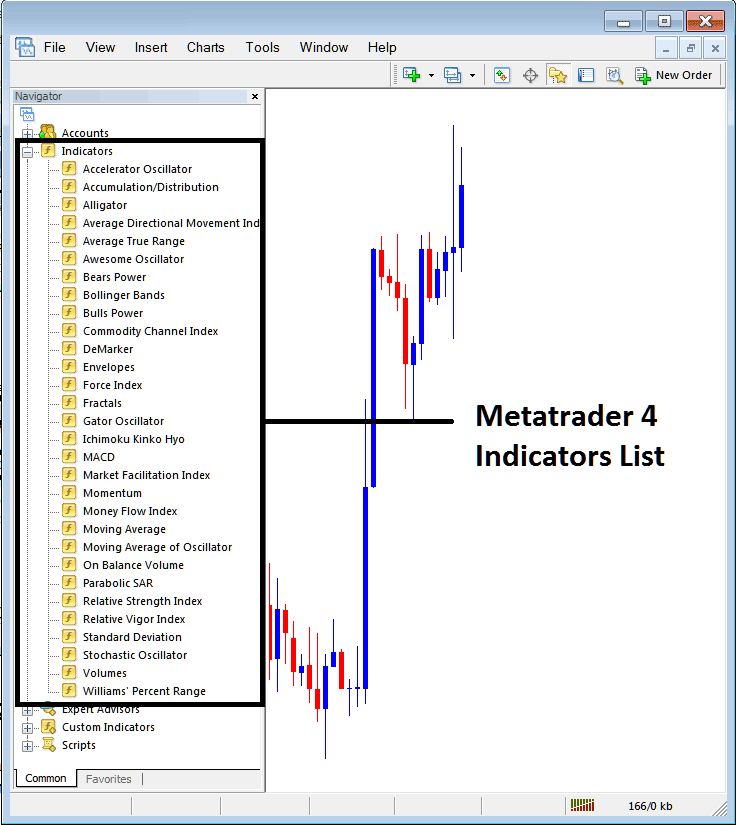
How to Add Bears Power Indicator - From the Above window you can then place Bears Power indicator that you want on the Forex chart
How to Add Custom Bears Power Indicator to MT4
If the technical indicator you want to add is a custom indicator - for example if the Bears Power technical indicator you want to add is a custom indicator you will need to first add this custom Bears Power indicator on the MetaTrader 4 platform & then compile custom Bears Power indicator so that the newly added Bears Power custom indicator pops up on the list of custom indicators in MetaTrader 4 software.
To learn how to install Bears Power indicators on MT4, how to add Bears Power indicator window to MT4 and how to add Bears Power custom indicator in MT4 - How to add a custom Bears Power indicator in MetaTrader 4.
About Bears Power Technical Indicator Tutorial Explained
Bears Power Technical Analysis & Bears Power Signals
Created by Alexander Elder
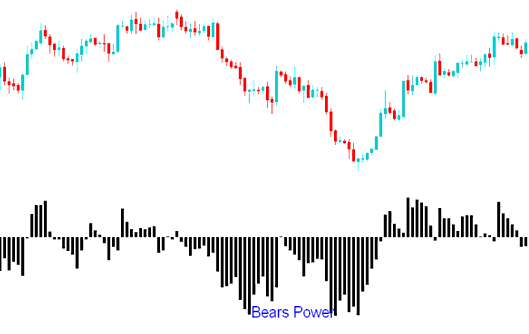
Bears Power is used to estimate power of the Bears (Sellers). Bears Power estimates the balance of power between the bulls and bears.
This indicator aims at identifying if a bearish trend will continue or if the price has reached a point where it may reverse.
Calculation
A Currency Price bar has 4 parameters: the Opening, Closing, High & Low of the price bar.
Each Price bar either closes higher or lower than previous price bar.
The highest price will signify and show the maximum power of the Bulls within a price period.
The lowest price will signify and show the maximum power of the Bears within a price period.
This technical indicator uses the Low of the price & a Moving Average (Exponential)
The moving Average represents the middle ground between sellers and buyers for a certain price period.
Therefore:
Bears Power = Low Price - Exponential Moving Average
Forex Technical Analysis & Generating FX Signals
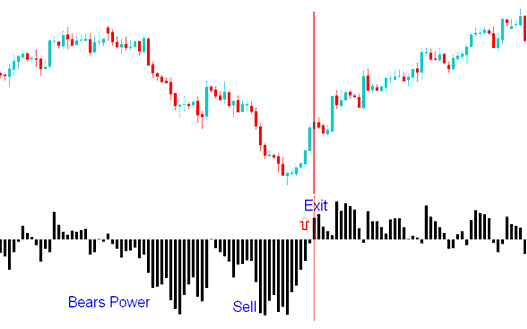
Sell Forex Signal
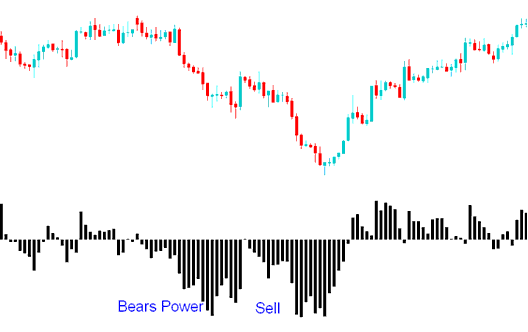
A sell signal is generated when oscillator moves below Zero.
In a down trend, the LOW is lower than EMA, so the indicator is below zero and Histogram/Oscillator is located below zero line.
Exit Trading Signal
If the LOW moves above the EMA then it means that price are starting to rise, the histogram rises above the zero line.
The Triple Screen technique for this indicator suggests identifying the price trend on a higher chart interval (like daily time frame) and applying the bears power signals on a lower chart interval (like hourly time frame). Signals are traded according to the lower time frame but only in the direction of the long term trend in the higher chart time frame.


