How Do I Analyze T3 Moving Average Technical Indicator Buy Forex Signal & Sell Signal?
T3 Moving Average How to Analyze Indicator Buy Signal
How Do I Analyze Buy Forex Signal Using T3 Moving Average Indicator?
Steps on how to analyze forex buy signals using T3 Moving Average indicator:
This T3 Moving Average indicator buy signal lesson gives an explanation of how to analyze forex buy signals using the T3 Moving Average indicator as shown on example below:
T3 Moving Average Forex Crossover Trading Signal
This Method involves using two T3 Moving Average indicators & generating forex trading signals when the two T3 Moving Averages cross over each other either upwards generating an upward forex trend signal or cross downward generating a downwards forex trend signal.
Bullish Forex Trading Trend
Forex prices are bullish as long as price action remains above the T3 Moving Average indicator - when this happens it signals that forex prices are bound to continue moving upwards.
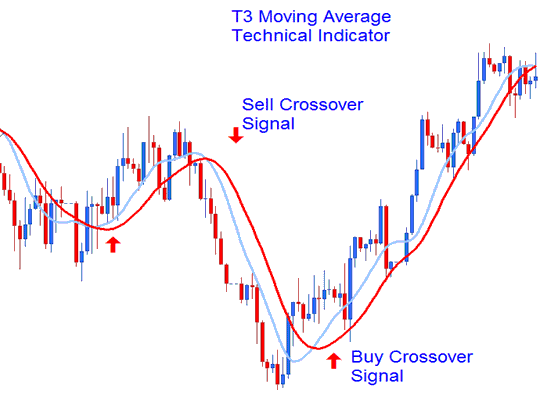 T3 Moving Average Technical Indicator Crossover Forex Signal
How Do You Interpret T3 Moving Average Indicator?
T3 Moving Average How to Analyze Indicator Sell Signal
How Do I Analyze Sell Forex Signal Using T3 Moving Average Indicator?
Steps on how to analyze forex sell signals using T3 Moving Average indicator:
This T3 Moving Average indicator sell signal lesson gives an explanation of how to analyze forex sell signals using the T3 Moving Average indicator as shown on example below:
Moving Average FX Crossover Forex Signal
This Method involves using two T3 Moving Average indicator & generating signals when the 2 cross each either upward generating an upwards Forex trend signal or cross downward generating a downwards trend Signal.
Bearish Forex Trend
Prices are bearish as long as price action remains below the T3 Moving Average indicator. When the forex price is below the T3 Moving Average indicator it signals that forex prices are bound to continue moving downwards.
T3 Moving Average Technical Indicator Crossover Forex Signal
How Do You Interpret T3 Moving Average Indicator?
How Do You Interpret T3 Moving Average Indicator?


