How Do I Analyze Linear Regression Slope Indicator Buy Forex Signal and Sell Signal?
Linear Regression Slope How to Analyze Indicator Buy Signal
How Do I Analyze Buy Forex Signal Using Linear Regression Slope Indicator?
Steps on how to analyze forex buy signals using Linear Regression Slope indicator:
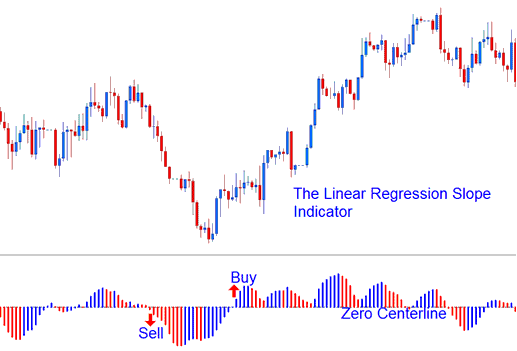
This Linear Regression Slope indicator buy signal lesson gives an explanation of how to analyze forex buy signals using the Linear Regression Slope indicator as shown on example below:
The Linear Regression Slope indicator regression slope is displayed as a bi-color histogram that oscillates above and below zero center line mark. The center line that is used to analyze Forex trading signals is set at the 0 mark.
- A rising Linear Regression Slope indicator slope - greater than the previous value of 1 forex candlestick ago - is displayed in the Blue Upward Slope color.
How Do I Interpret Linear Regression Slope Indicator?
How Do I Interpret Buy Forex Signals Using Linear Regression Slope Indicator
Linear Regression Slope How to Analyze Indicator Sell Signal
How Do I Analyze Sell Forex Signal Using Linear Regression Slope Indicator?
Steps on how to analyze forex sell signals using Linear Regression Slope indicator:
This Linear Regression Slope indicator sell signal lesson gives an explanation of how to analyze forex sell signals using the Linear Regression Slope indicator as shown on example below:
The Linear Regression Slope indicator regression slope is displayed as a bi-color histogram that oscillates above and below zero center line mark. The center line that is used to analyze forex trading signals is set at the 0 mark.
- A declining Linear Regression Slope indicator slope - lower than the previous value of 1 forex candlestick ago - is displayed in the Red Downward Slope color.
How Do I Interpret Linear Regression Slope Indicator?
How Do I Interpret Sell Forex Signals Using Linear Regression Slope Indicator
How Do I Interpret Linear Regression Slope Indicator?


