How Do I Analyze Linear Regression Indicator Buy Forex Signal & Sell Signal?
Linear Regression How to Analyze Indicator Buy Signal
How Do I Analyze Buy Forex Signal Using Linear Regression Indicator?
Steps on how to analyze forex buy signals using Linear Regression indicator:
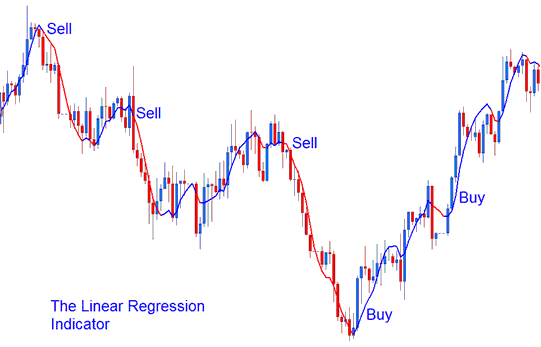
This Linear Regression indicator buy signal lesson gives an explanation of how to analyze forex buy signals using the Linear Regression indicator as shown on example below:
Linear Regression technical indicator looks like a moving average but it has a bi-color representation.
- Bullish Buy Forex Signal (Blue color) - A rising Linear Regression indicator line - greater than its previous value, 1 previous forex candlestick bar before - is displayed in the upward trend - blue color.
How Do You Interpret Linear Regression Indicator?
How Do You Interpret Buy Forex Signals Using Linear Regression Technical Indicator
Linear Regression How to Analyze Indicator Sell Signal
How Do I Analyze Sell Forex Signal Using Linear Regression Indicator?
Steps on how to analyze forex sell signals using Linear Regression indicator:
This Linear Regression indicator sell signal lesson gives an explanation of how to analyze forex sell signals using the Linear Regression indicator as shown on example below:
Linear Regression technical indicator looks like a moving average but it has a bi-color representation.
- Bearish Sell Forex Signal (Red color) - a declining Linear Regression indicator line - lower than its previous value, 1 previous forex candlestick bar before - is displayed in the downward forex trend - red color.
How Do You Interpret Linear Regression Indicator?
How Do You Interpret Sell Forex Signals Using Linear Regression Technical Indicator
How Do You Interpret Linear Regression Indicator?


