How Do I Analyze CCI Indicator Buy Forex Signal and Sell Signal?
CCI How to Analyze Indicator Buy Signal
How Do I Analyze Buy Forex Signal Using CCI Indicator?
Steps on how to analyze forex buy signals using CCI indicator:
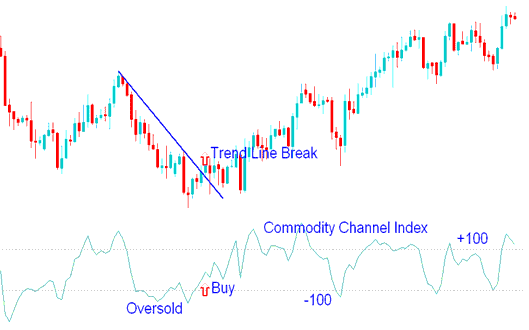
This CCI indicator buy signal lesson gives an explanation of how to analyze forex buy signals using the CCI indicator as shown on example below:
How Do I Analyze CCI Indicator Buy Forex Signal?
If the CCI is oversold, levels below? -100, then there is a pending market correction.
The oversold levels will remain intact until CCI starts to move above? -100.
When forex price starts moving above? -100 then this is interpreted as a buy signal.
The CCI indicator buy signal should be combined with forex trend-line break signal to confirm the buy signal.
How Do I Interpret CCI Indicator?
CCI How to Analyze Indicator Sell Signal
How Do I Analyze Sell Forex Signal Using CCI Indicator?
Steps on how to analyze forex sell signals using CCI indicator:
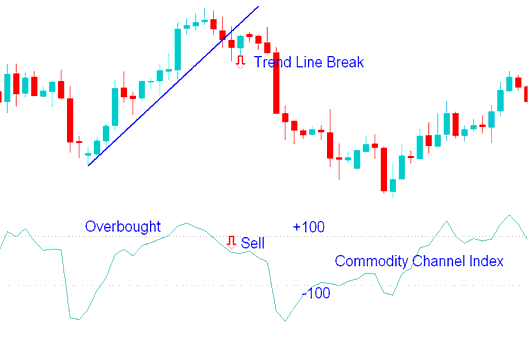
This CCI indicator sell signal lesson gives an explanation of how to analyze forex sell signals using the CCI indicator as shown on example below:
How Do I Analyze CCI Sell Forex Trading Signals?
If the CCI is overbought, levels above +100, then there is a pending forex price correction.
CCI indicator overbought levels will remain intact until CCI starts to move below +100.
When forex price starts moving below +100 then this is interpreted as a sell signal.
This CCI indicator sell signal should be combined with forex trend-line break signal to confirm the sell signal.
How Do I Interpret CCI Indicator?
How Do I Interpret CCI Indicator?


