How Do I Analyze Bulls Power Indicator Buy Forex Signal and Sell Signal?
Bulls Power How to Analyze Indicator Buy Signal
How Do I Analyze Buy Forex Signal Using Bulls Power Indicator?
Steps on how to analyze forex buy signals using Bulls Power indicator:
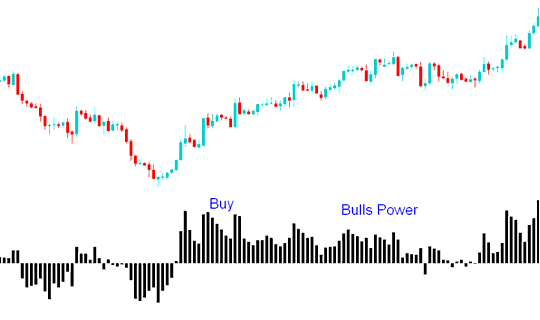
This Bulls Power indicator buy signal lesson gives an explanation of how to analyze forex buy signals using the Bulls Power indicator as shown on example below:
Buy Trading Signal
A buy trading signal is generated when Bulls Power oscillator moves above Zero.
In an upward trend, the HIGH is higher than EMA, so the Bulls Power technical indicator is above zero and Histogram/Oscillator is located above zero line mark.
How Do I Interpret Bulls Power Indicator?
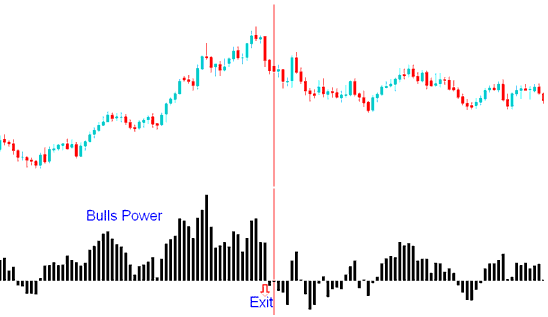
Exit Forex Signal
If the HIGH falls under EMA then it means that forex price are starting to fall - then the Bulls Power histogram falls below the zero line mark.
How Do I Interpret Bulls Power Indicator?
The Triple Screen technique for this indicator suggests identifying the forex price trend on a higher forex chart interval (like daily chart time frame) and applying the bulls power forex indicator on a lower forex chart interval (like hourly chart time frame). Forex signals are traded according to the bulls power forex indicator but only in direction of the long term forex trend in the higher forex trading chart timeframe.
How Do I Interpret Buy Forex Signals Using Bulls Power Indicator
Bulls Power How to Analyze Indicator Sell Signal
How Do I Analyze Sell Forex Signal Using Bulls Power Indicator?
Bulls Power Indicator is used to Analyze Buy Forex Signals Only
How Do I Interpret Sell Forex Signals Using Bulls Power Indicator
How Do I Interpret Bulls Power Indicator?


