FX Divergence Definition - RSI Divergence Indicator Analysis
Divergence concept is a concept where a trader will for a difference between the currency price movement with the movement of a indicator. For our example we shall use the RSI to illustrate divergence setups.
RSI is one of the oftenly used divergence trading indicator. This indicator is an oscillator technical indicator similar to the RSI & it can be used to trade divergence just the same way as the RSI technical indicator.
RSI Analysis and RSI Signals
RSI Trade Divergence Technical Indicator
RSI Bullish Trade Divergence Setups - RSI FX Divergence Indicator
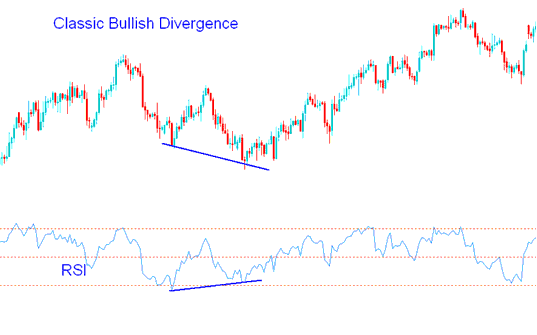
Classic RSI Bullish Divergence
RSI classic bullish divergence occurs when the price is forming/making lower lows (LL), but the RSI is forming/making higher lows ( HL ).

Classic Bullish Divergence - RSI Divergence Definition
RSI classic bullish divergence setup warns of a possible change in the trend from downward to upward. This is because even though the price went lower the volume of the sellers who pushed the price lower was less like illustrated by the RSI. This is an indicator of the underlying weakness of the downward trend.
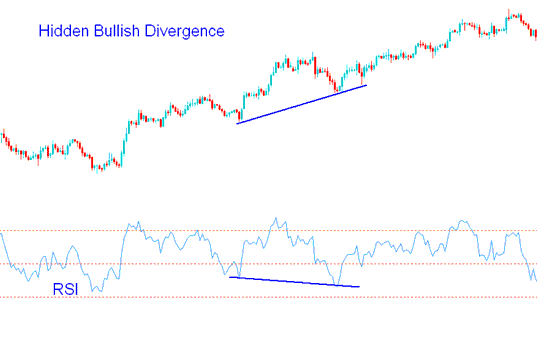
Hidden RSI Bullish Divergence Trade Setup
Forms when price is forming/making a higher low (HL), but the RSI is displaying a lower low ( LL ).
RSI hidden bullish divergence occurs when there a retracement in an uptrend.

Hidden Bullish Divergence - RSI Divergence Definition
This setup confirms that a retracement move is exhausted. This RSI divergence reflects underlying momentum of an uptrend.
RSI Bearish Trade Divergence Setup - RSI Trade Divergence Indicator
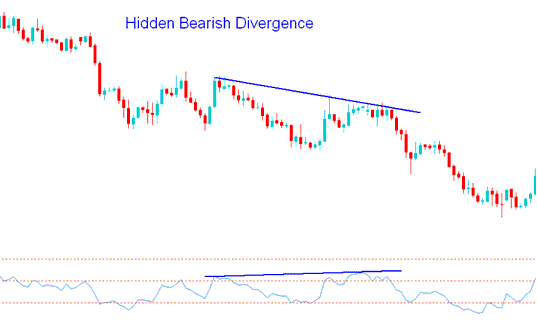
Hidden RSI Bearish Divergence Trade Setup
Forms when price is forming/making a lower high (LH), but the oscillator technical indicator is forming/making a higher high ( HH ).
Hidden bearish divergence forms when there a retracement in a downtrend.

Hidden Bearish Divergence - RSI Divergence Definition
This setup confirms that a retracement move is exhausted. This divergence reflects the underlying momentum of a downtrend.
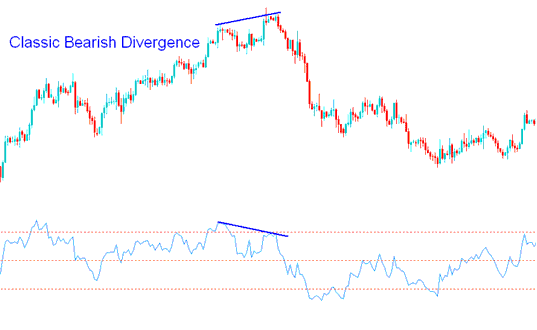
RSI Classic bearish Divergence
RSI classic bearish divergence occurs when the price is forming a higher high (HH), but the RSI is making lower high ( LH ).

Classic Bearish Divergence - RSI Divergence Definition
RSI Classic bearish divergence setup signals a possible change in trend from up to down. This is because even though the price went higher the volume of the buyers who pushed the price higher was less just as is illustrated and shown by the RSI. This is an indicator of the under-lying weakness of the upward trend.
Study More Courses & Tutorials:
- Gold Online
- Identifying XAUUSD Classic Bullish Divergence Setups & XAUUSD Classic Bearish Trading Divergence Setups in XAUUSD
- Choppiness Index Gold Indicator Technical Analysis in XAU USD Charts
- Awesome Oscillator Analysis
- How Can I Read MT4 Trade Charts Trading Analysis?
- How to Add Commodity Channel Index CCI in Forex Chart
- Learn Forex Principles of Trade Forex Psychology
- FX Trading Platform Software MetaTrader 4 Terminal Window Panel
- Symmetrical Triangles Pattern Consolidation Trade Pattern
- Buy Long Trade - What is Opening Long?


