Bollinger Band width MetaTrader 4 Indicator & Bollinger Band width Signals
Developed by John Bollinger.
This MT4 Indicator is derived from the original Bollinger MetaTrader 4 Indicator.
Bandwidth is a measure of the width of the Bollinger Bands.
Calculation
Bandwidth = Upper Band - Lower Band
Middle Band
This is an MetaTrader 4 Indicator, based on the theory that price and volatility occurs in cycles.
Periods of high volatility is followed by periods of low volatility.
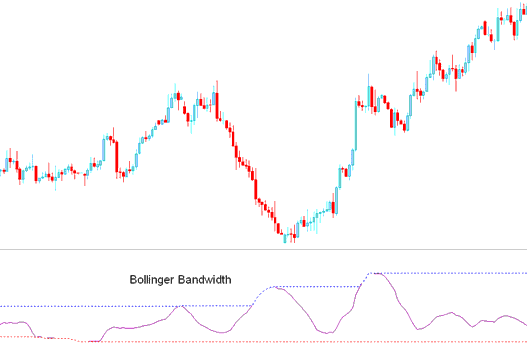
When volatility is high, bands are far apart, the bandwidth will also be wide apart.
When volatility is low, Bands are narrow and the bandwidth MetaTrader 4 Indicator will also not be narrow.
The blue line represents the highest Bandwidth value for a previous number of periods.
This line also identifies periods of high volatility
The redline represents the lowest Bandwidth value for a previous number of periods.
This line also identifies periods of low volatility
MetaTrader 4 Indicator & Generating Signals
Consolidation - Bollinger Squeeze
Bollinger Bandwidth is used to identify the squeeze, which is a consolidation period of price, after which the price then breaks out in a particular direction.
Signals are generated when there is a forex price breakout signal is generated by the MetaTrader 4 Indicator starting to go up after touching the red line. When the bandwidth line starts to move up it signifies that volatility is rising as the price is breaking out.
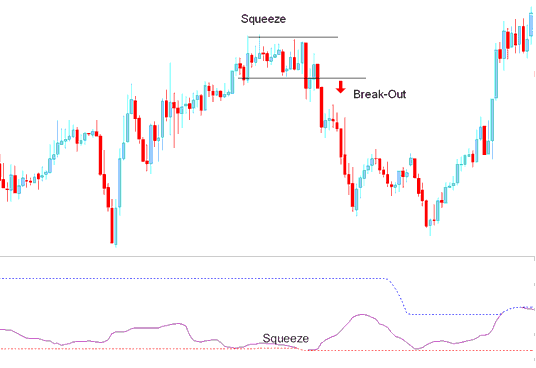
Squeeze
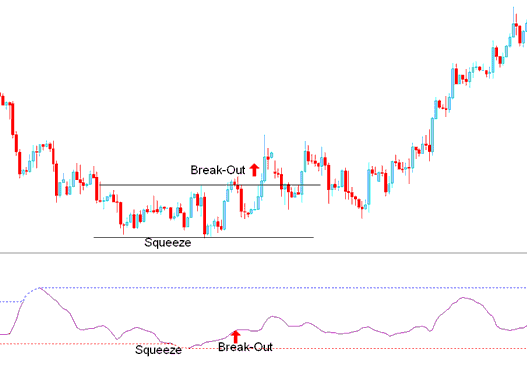
Breakout Signal After Bandwidth Squeeze
However, this is a directionless MetaTrader 4 Indicator & needs to be combined with another MetaTrader 4 Indicator such as the moving average to determine the direction of the trend/ Breakout.


