Bollinger Bands MT4 Indicator and Bollinger Bands Signals
Developed by John Bollinger.
This indicator serves 3 primary functions:
- Provide a relative definition of high and low
- Show periods of high & low volatility
- Identify periods when prices are at extreme levels
Bollinger Bands do this by using standard deviations as a measure of volatility. Since standard deviations technical indicator is a measure of volatility, the bands are self-adjusting: they widen during periods of higher volatility and contract during periods of lower volatility.
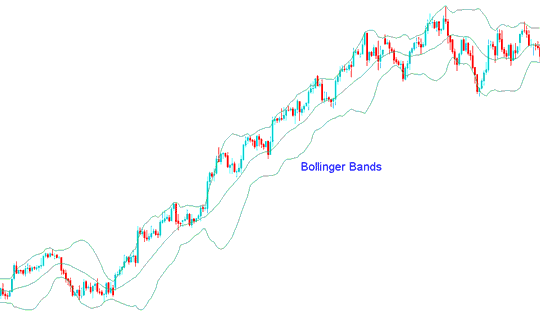
This indicator consist of 3 bands designed to encompass the majority of a trading instrument's price action. The middle band is a basis for the intermediate-term Forex trend, typically a 20-periods simple moving average, which also serves as the base for the upper and lower bands.
The upper band's and lower band's distance from the middle band is determined by volatility. Typically, the upper band is plotted +2 standard deviations above the middle band while the lower band is plotted -2 standard deviations below the middle band.
Interpretation
Bollingers are usually calculated using the trading instrument's prices and they have the following characteristics.
- Sharp price changes tend to occur after the bands tighten as volatility lessens, this is known as Bollinger band squeeze.
- When prices move outside the bands a continuation of the current trend is implied.
- Bottoms and tops made outside the bands followed by bottoms & tops made inside the Bollinger Bands respectively, call for reversals in the Forex trend.
- A move which originates at one band tends to go all the way to the other band.
FX Trading Trend Identification
This MetaTrader 4 Indicator is used as a trend following indicator since it shows the general direction of the Forex trend.
If the trend is upwards middle and the lower bollinger provide excellent points for opening a buy trade, these levels act as support levels.
In a down trend the middle & the upper bollinger provide excellent points for opening a sell trade. These levels are used as resistance zones.
The outer levels are also commonly used to set stop loss levels above or below these outer levels bands.


