Different Type of Market Technical Analysis
What's a Momentum Trend?
A momentum trend is a trend that is moving faster than the one before, and it can be shown with a trend line that is steeper than the previous one. When a new line appears that is steeper than the old one, it means the trend has gained more strength and is becoming much stronger. These kinds of patterns need to be looked at in a different way.
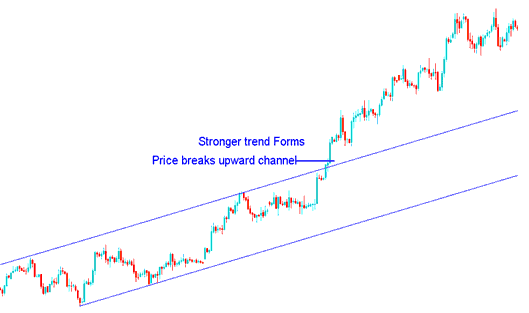
Check the example under this. Price up in a channel? A break higher builds a firm trend, like the pic shows. Trader, if your chart snaps an up line higher in a climb like below, skip sells. Add more deals instead. Keep this XAUUSD note - it built big cash in the review under.

Channel Break Up - More Strength on Up Movement
From the trading examples above, we see new steeper trendlines form. They show the trend gaining power.
This phenomenon is visually represented by the steeper trendlines that can be mapped as price action advances.
The fresh trend carries more force than the old one. The steeper trendline shows this clearly.
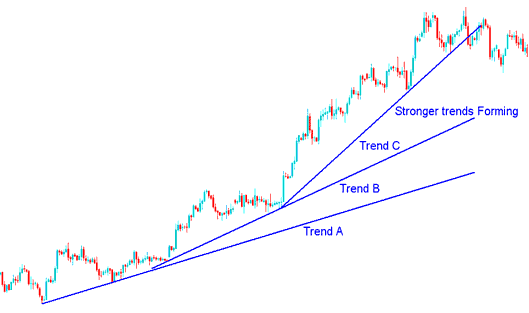
This creates trendlines B and C, like you see in the diagram below drawn in MetaTrader 4. The chart shows how the price energy formed a new, steeper line.
You can see this in the example below, where lines A, B, and C show how strong trends form as the market keeps building momentum.

Price Gathering More Momentum
When the steepest trend line breaks, odds are the other trend lines will break soon too. The smart move is to take your profits once you see that steep line give way.
This trading approach is also applicable for short-term traders, including day traders, intra-day traders, and scalpers, and these patterns typically develop on the 5-minute and 15-minute charts. Parabolic trend lines can indicate where to set take profit orders. A trader should promptly secure profits once the steepest trend line is breached.
How Do I Trade These
Checking the trend of momentum is a helpful way to know when to take your earnings before other people do. This pattern of trading based on momentum often shows up on charts that look at 1, 5, or 15 minutes, so it works well for quick and short-term traders. If you're trading within the same day (which a lot of people do), it's usually best to look at the 15-minute chart, or sometimes the 5-minute one. Let's say you start a buy or sell that doesn't last long, and the market goes a little bit in your favor – once you see that pattern, it's a good idea to leave when the steepest trend line breaks and make sure you get your profit.
Technical Analysis Example
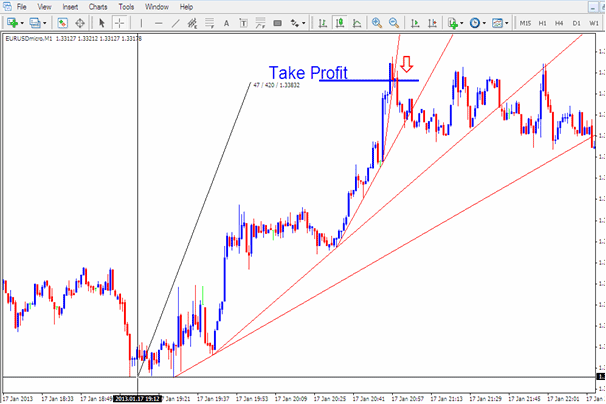
For this illustration, we will utilize a short-term chart measured in minutes for plotting: when the setup appeared as shown below, it represented an opportune moment to secure profits.

Trading the Momentum Market Moves
In the previous example, a trader who anticipated a long position would have waited for the steepest trend line to be broken before closing the trade, thereby securing a profit of 42 pips from this buy. This individual would have exited the trade at an opportune moment, effectively avoiding the subsequent range-bound market.
What's it?
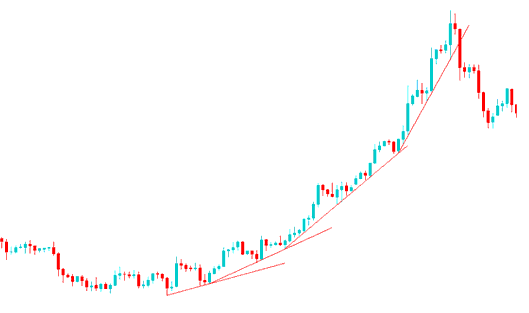
Sometimes, the market goes up very quickly, like a curve, and this happens when people panic and prices go straight up. When prices go up like this, there are almost no sellers, which makes even more people want to buy. When this happens, traders quickly try to get into the market, no matter the price, because they don't want to miss out. This can make the price move the most in a short time, and traders will place buy orders in this situation.
For this type of transaction, it is advisable to continue purchasing - there is no requirement for analysis, simply persist in buying.
Some trends can run for months, even years. If the weekly and monthly trend lines hold, just keep buying. Stick with the trend until those lines finally break.
When XAUUSD moves like this, the highest point it reaches usually indicates the end of a move, and prices often don't go back to those very high levels for a significant period. Once this level is hit and the steepest trendline breaks, it's wise to view it as a change in price direction, and it's a good idea to take a break from trading and enjoy your profits before planning your next step.
The same thing can happen during a downtrend when panic selling kicks in and prices drop sharply. You see this a lot during recessions.
A trendline with a sharp slope loses trust fast. Exit the trade if the steepest one breaks. Look at the oil chart below for a parabolic rise. Gold shows another case on weekly or monthly views. It happened soon after the oil line snapped.

If, as a trader, you observe a steeply rising (parabolic) XAUUSD trend in an upward direction, the recommended action is simply to maintain aggressive buying: this approach is highly likely to generate profits trading with that momentum. No supplementary analysis beyond referencing the trendlines is necessary. The crucial element is exiting swiftly once the steepest incline is passed, as reversals on this formation are exceptionally rapid, demanding equal speed on your part. Ensure your exit point is precisely timed, similar to the scenario depicted in the preceding illustration.
Review Further Programs & Programs:
- Examples of Forex Trading Strategies for Beginner Traders to Study
- Top Forex Pairs for Scalping in the Online FX Market
- RSI Trend-lines and Market Trend Lines on Different Indices Charts
- A Lesson Describing the XAU/USD Indicators
- CAC 40 Trading Indicator MetaTrader 4 Indicators
- Stochastics Oscillator Analysis Trade FX Strategies
- Practical Use of the Darvas Box Indicator in Forex Trading
- Best Time for Trading GBPSEK
