Gold Divergence XAU/USD SETUPS SUMMARY
Classic Bearish - HH price, LH indicator - Indicates the under-lying weakness of a price trend - Warning of a potential reversal in the trend from upward to downward.
Classic bullish setup: lower low in price, higher low in indicator. It shows trend weakness. Expect a shift from down to up.
Hidden bearish shows a lower high in price but a higher high in the indicator. It points to the real strength in a price trend. You often see it in pullbacks during a downtrend.
Hidden Bullish - HL price, LL indicator - Shows the strength of a trend - Usually happens when prices go down a bit in an upward trend.
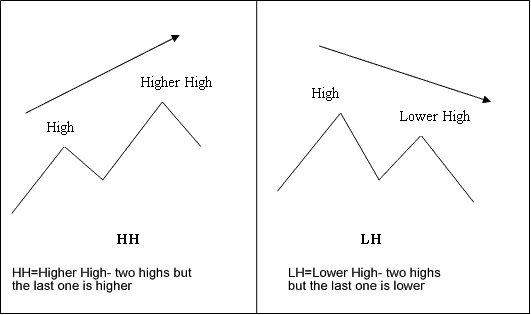
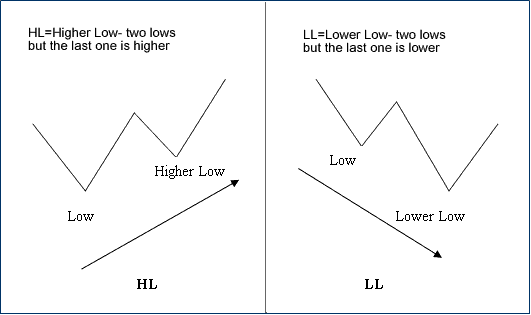
Illustrations of the divergence trading setup terms:
M-shapes dealing with price highs

M shapes
W-shapes dealing with the price lows

W shapes
These are shapes to look for when using these setups.
One of the best indicator for this gold setup is the MACD Indicator - as a trade signal MACD divergence setup is a set-up to enter a trade position. But as with any trading signal there are certain guidelines which have to be looked at to make this trading signal a set-up. Getting straight into a trade position as soon as you see this xauusd setup isn't the best strategy. This setup should be used in combination with another indicator to confirm the direction of the market trend. A good trading strategy to combine together with is the MA cross-over method.
Please note that the xauusd setup on a smaller time frame is not particularly significant. When divergence appears on a 15-minute chart, it may or may not hold substantial importance when compared to the analysis of the 4-hour chart time frame on the MetaTrader 4 platform.
If you see it on a 60-minute, 4-hour, or daily chart, look for other things that might show when the price will react to the difference.
This brings us to a key point when using this trading signal to enter a position: on a higher time-frame MACD divergence setup can be a fairly reliable technical indicator of a reversal in price direction. However, the large question is: WHEN? That is why getting straight into a trade position as soon as you observe this xauusd setup isn't always the best trade strategy.
Many participants/investors become premature in their market entry upon observing an MACD divergence setup. Frequently, the price trend retains considerable momentum to continue in its established direction. Investors who enter too early are often left watching dismayed as the price pierces their stop-loss order, resulting in being taken out of the trade.
If you only look for the xauusd setup without considering anything else, you won't have the best chances. To boost the chances of making a successful trade, as a gold trader, you should also look at other factors, especially other technical indicators.
Other Factors to Consider in This Gold Trading Setup?
1. Support, Resistance, and Gold Fibonacci Levels on Higher Time Frame Charts
Another way to greatly improve your chances of a successful trade is to look at the bigger time frames before placing a trade based on the smaller time frames.
If you notice that the hourly, H4, or daily XAUUSD chart has reached a key resistance, support, or Fibonacci level, then your chances of a good trade increase if you see divergence on a shorter time-frame.
2. Reward to Risk Ratio: Gold Money Management Guidelines
When spotting divergence, enter trades right for a solid risk-reward setup. Only take XAUUSD trades where potential gains beat your risk. Know how to enter well, and you can check the ratio before trading. Pick orders with good ratios that way.
Finally, when it is used right and mixed with other indicators to back up this trade signal, setting up a divergence trade can have great profit potential.
Learn More Tutorials & Courses:
