XAU USD Demo Account - XAUUSD Practice XAUUSD Trading
For any trader who wants to start trading gold online, the best way to start is by using a demo demo account. This way a trader will learn about how to open and close XAUUSD trades, how to open Gold charts and place indicators on the xauusd charts and also get to know about the leverage and margin used to trade gold & how to use money management so that to manage trading with leverage.
The first thing a gold trader should pick up from their demo account is how to spot which way gold prices are moving. That way, they know which side of the market to be on.
There are two market directions, up or down. When prices go up, a trader buys XAUUSD, and when they go down, a gold trader sells gold. The example below shows how to spot an upward and a downward market direction.
How To Open Buy Trade
Traders spot buy times on the gold price chart with indicators. They add these tools to the chart. Indicators measure market direction and its strength.
For instance, the Gold trade illustrated below is a buy trade - we will clarify how you can ascertain this for yourself while trading.
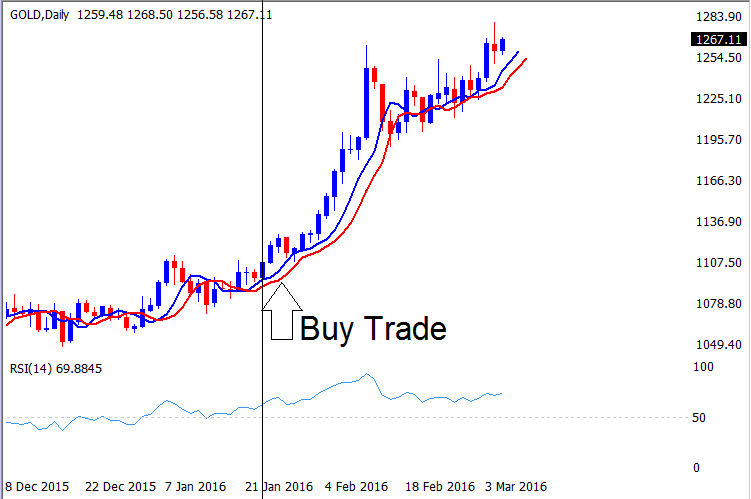
The chart shows prices heading up first. As a trader, add a few indicators. They give more details on this uptrend.
The RSI and moving averages are the two indicators included on this chart.
Two moving averages create a crossover system. A signal forms when they cross and head the same way. Use a short one like five-day and a long one like seven-day.
- When both moving averages are moving upwards the price trend direction is upward
- When both moving averages are moving downward the price trend direction is downwards
The second indicator is the RSI. Traders use RSI to confirm the direction of the price trend. If RSI is above the 50 mark, like in the example above, it means prices are generally closing higher than where they opened.
In the example above, the RSI is above the 50 mark, so the upward trend is confirmed by the RSI. If the RSI stays above 50, it means the price of xauusd will keep going up.
Traders will utilize these two indicators to establish trading rules for initiating trades. These rules will collectively form what is referred to as a trading system.
The rules are: If both MAs are rising and the RSI is over the 50 center line, then you should buy as shown above.
How To Open Sell Trade
To open a sell trade position like in the illustration laid-out:
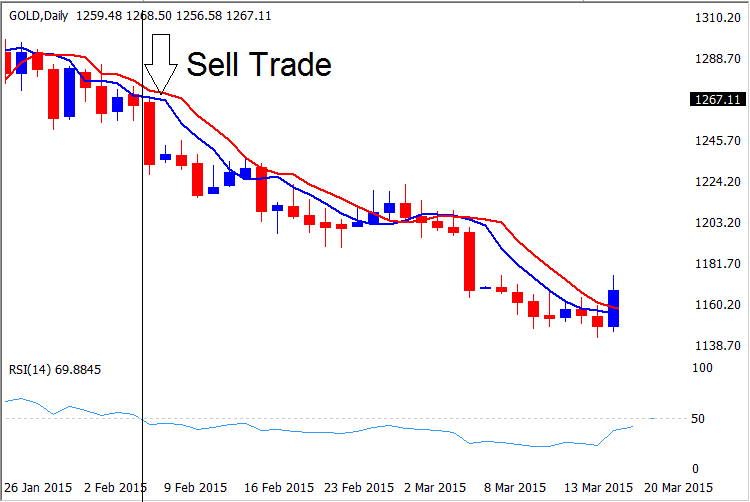
Someone should start a trade to sell if both moving averages are going down and the RSI shows it's under the 50 mark. When the RSI is under 50, it usually means prices are ending lower than they started, so gold prices are likely trending downward.
Once a trader knows how to determine which trade to place using the gold trading charts the next thing to learn is how to open a gold chart on the xauusd trading platform and how to open a new transaction.
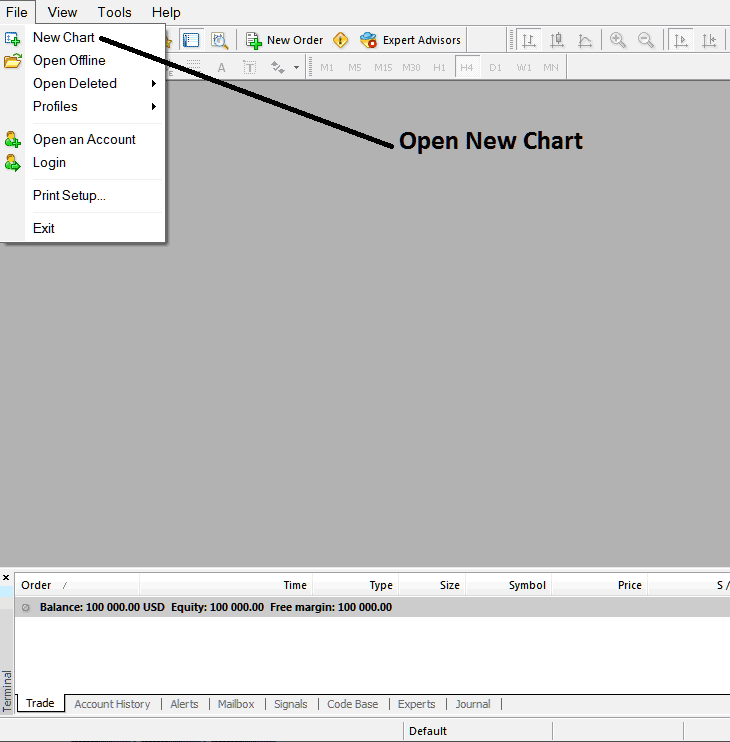
Opening a Gold Chart
Traders open a new chart from the file menu on their platform. See the steps below.
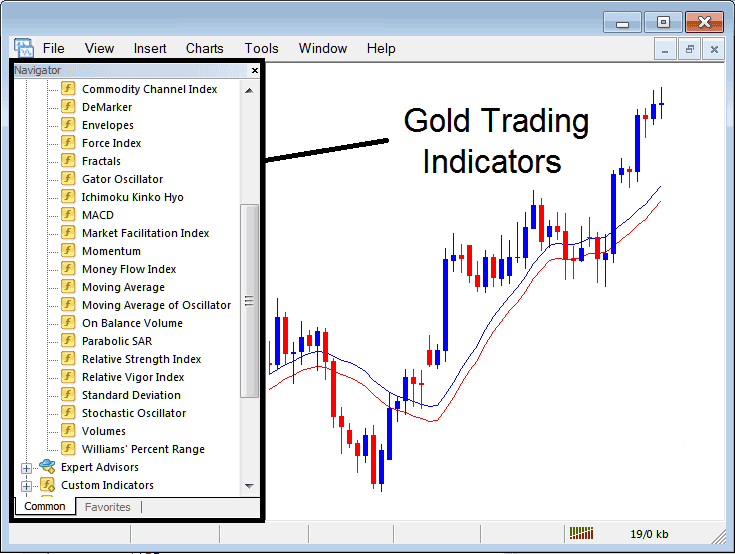
Placing Technical Indicators on a Chart
A trader can also place chart indicators directly from the navigator menu panel on the trading platform. To go to the navigator menu that is displayed below a trader can click the view menu on the top left corner of the trading platform next to the file menu & choose navigator - shortcut keyboard keys are pressing CTRL+N to show this navigator panel window.
A trader will also utilize this demo trading account to familiarize themselves with the XAU/USD platform, as illustrated below.
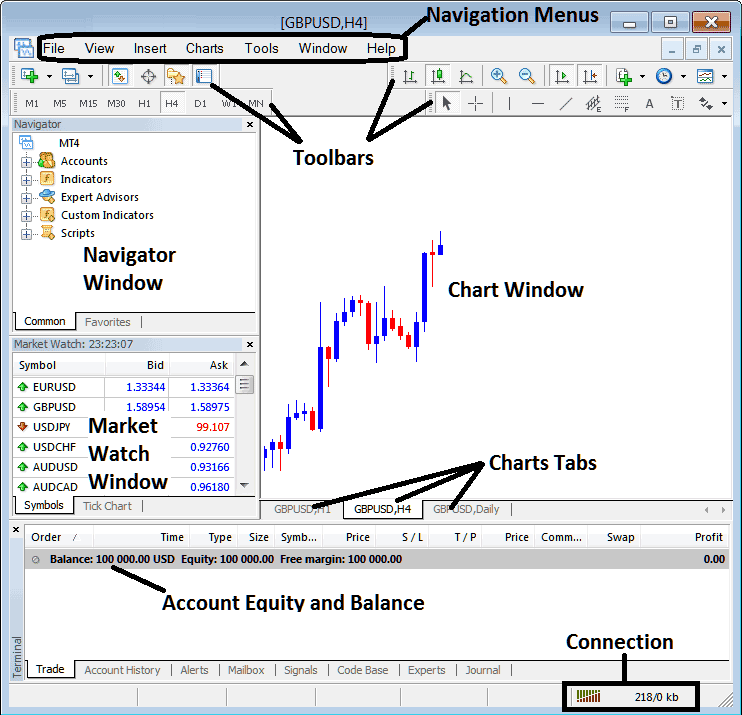
A trader can use the demo trade account to learn how to navigate the above platform and how to check their account balance such as shown above.
This demo account helps learn gold trading basics. Try out the tools without risk. No real money goes in. It uses fake funds only. Practice until you know enough to trade gold for profit. Then switch to a live account with real cash.
Review Further Directions & Instructional Material:
- What's GBPSGD Spreads?
- List of Technical XAU/USD Indicators for XAU USD
- Strategy for Trade SMI20 Indices
- Darvas Box XAU USD Indicator Trading Analysis in Trading Charts
- How do you interpret a quote in MetaTrader 4?
- Set RSI Indicator on MT4 XAUUSD Charts for Day Trading Analysis
- SWI 20 Strategy Example
- AS51 Indices Trading Blueprint: Steps to Construct a Trading System for AS51 Index