
Reversal Patterns Double Top and Double Bottoms Patterns
Reversal patterns form after a big move up or down. Price hits a key resistance or support level.
When the cost gets to a certain spot, it starts making a pattern – like a turnaround chart pattern. Because these patterns show up and take shape often, it's simple to spot them once you learn how and start using them.
There are 4 types of reversal patterns:
- Double Top
- Double Bottoms
- Head and shoulders
- Reverse Head & shoulders
This guide will focus only on double tops and double bottom chart shapes: the other two will be discussed in the next guide: head and shoulders and reverse head and shoulders shape.
Double Tops - Reversal Setup
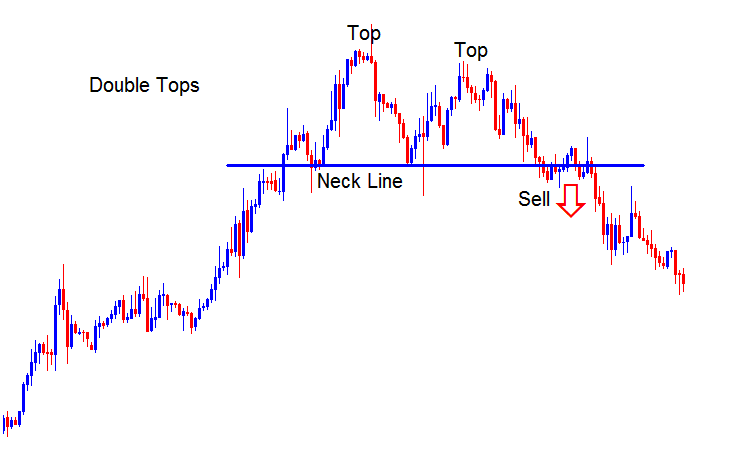
This double tops chart pattern is a reversal chart pattern that forms after an extended upward market trend. As its name implies, this setup is made up of 2 consecutive peaks that are roughly equal, with a moderate trough in between.
This double top is seen as complete when the price creates a second high point and then goes below the lowest spot between the high points, known as the neck line. The sell signal from this chart pattern happens when the market goes below the neck line.
In XAUUSD trading, this setup serves as an early warning signal indicating that a bullish Gold price trend may be about to reverse. However, confirmation occurs only when the neckline is breached and the market falls below this level. The neckline is simply another term for the last support level established on the Gold price chart.
Summary:Forms after an extended move upwards
This setup reflects that there will be a reversal in the market
We initiate a sell when the price breaks below the neckline: refer below for further explanation.
Double Tops Reversal Setup
The double top reversal chart pattern resembles an M-Shape: the optimal reversal signal occurs when the second top is lower than the first, as illustrated below. This indicates that the reversal signal setup can be validated by drawing a downward trend line, as depicted below. If a trader initiates a sell trade, the stop loss should be positioned just above this downward trend line.
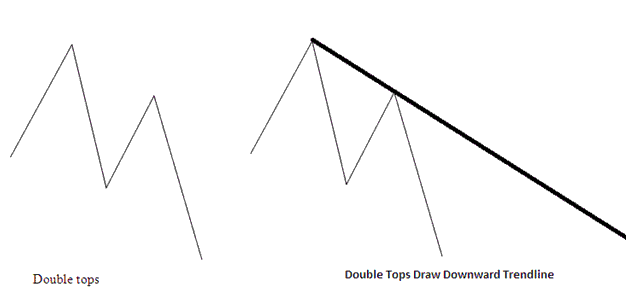
M-Shaped Double Tops Reversal Pattern - Downwards Trend-Line
Double Bottoms - Reversal Pattern
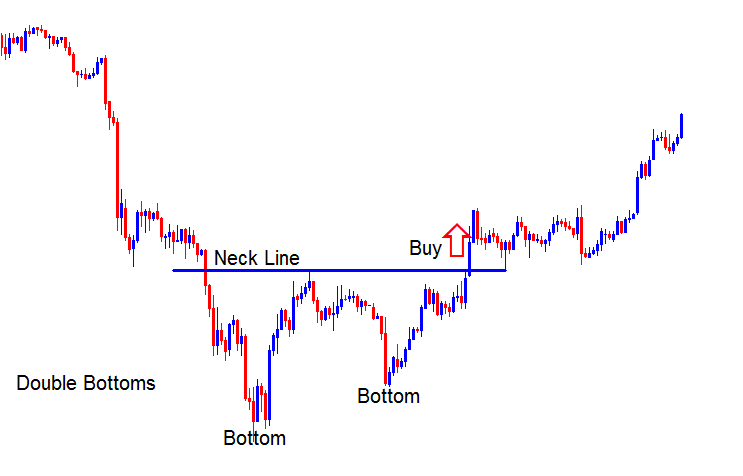
Double bottoms show up after a long slide down in price. You'll spot two low points, about the same level, with a bounce in between. It's a sign the trend might be turning.
A double bottom reversal finishes when price hits the second low and breaks past the peak between lows, known as the neckline. The buy signal kicks in as the price pushes above that neckline.
In Gold trading, this configuration serves as an early indication that the bearish trend in the Gold market is poised to shift and reverse. It is deemed complete and confirmed only when the neckline is breached to the upside. In this scenario, the neckline represents the resistance zone for the price. Once this resistance is surpassed, the market will ascend.
Summary:Forms after an extended move downwards
This pattern reflects that there will be a reversal in the market
We buy when price breaks above the neck-line: see below for an explanation.
Double Bottoms Reversal Pattern
Double bottoms form a W shape. The strongest signal comes when the second low sits higher than the first. Connect them with an uptrend line to confirm. Place stops below that line for buy trades in gold.
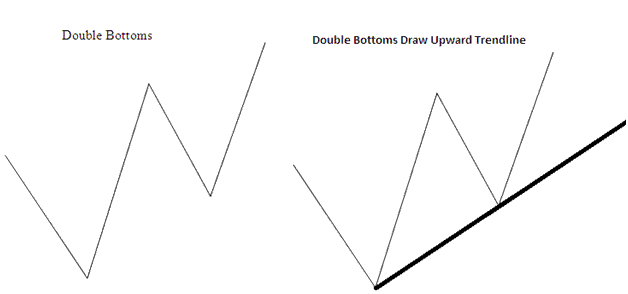
W-Shaped Double Bottoms Reversal Pattern - Upward Trend-Line
Learn More Lessons & Tutorials:
.