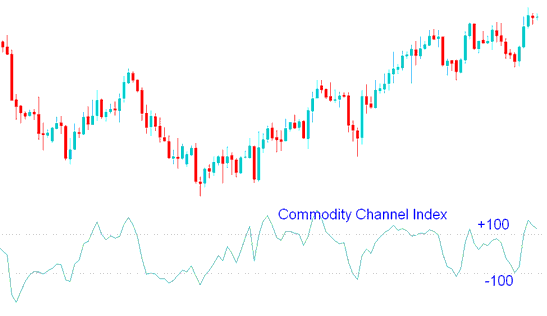
Commodity Channel Index (CCI) Technical Analysis and CCI Signals
Developed by Donald Lambert
The Commodity Channel Index measures the variation of a commodity price from its statistical mean/statistical average.
This indicator is an oscillator which oscillates between high levels & low levels
When the CCI is high it shows that price is unusually high compared to the its average.
When the CCI is low it shows that price is unusually low compared to the its average.
FX Technical Analysis & How to Generate Signals
Overbought/ Oversold Levels
The CCI typically oscillates between ±100.
Indicator values above +100 indicate an overbought conditions and an impending market correction.
Indicator values below -100 indicate an oversold conditions and an impending market correction
Buy Trading Signal
If the Commodity Channel Index indicator is over-sold, levels below -100, then there's a pending market correction.
The over-sold areas will remain intact until Commodity Channel Index indicator starts to move above -100.
When price starts moving above -100 then that is interpreted as a buy.
The Commodity Channel buy trading signal should be combined with a trend-line break signal to confirm the buy.
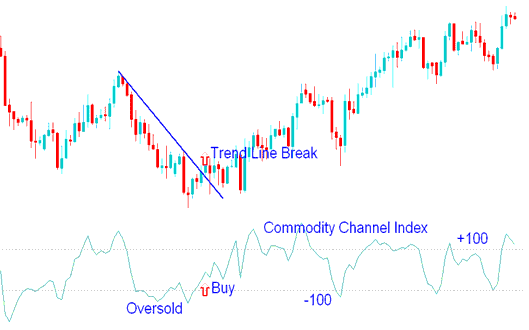
Buy Trade
Sell Trading Signal
If the Commodity Channel Index is overbought, zones above +100, then there is a pending market correction.
Over bought levels will remain intact until CCI indicator starts to move below +100.
When price starts moving below +100 then that is a interpreted as sell.
This Commodity Channel sell trading signal should be combined with a trend-line break signal to confirm the sell.
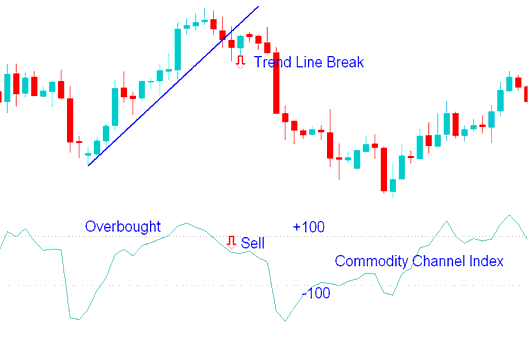
Sell Trade
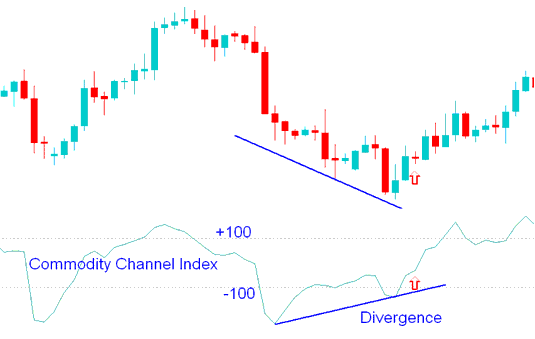
Forex Divergence Trading
Bullish FX Trading Divergence
Bullish divergence forms when price is making new lows while the CCI technical indicator is failing to surpass its previous low.
This is a bullish signal because the divergence will be followed by an upwards market correction.
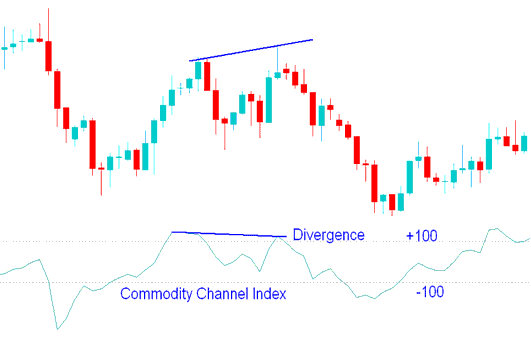
Bearish Forex Trading Divergence Setup
Bearish Divergence occurs when price is making new highs while the Commodities Channel Index indicator is failing to surpass its previous high.
This is a bearish signal because the divergence will be followed by a downward market correction.
Technical Analysis in FX Trading


