
Techniques for Trading Classic Bullish Divergence and Bearish Divergence Patterns
In XAUUSD trading, classic divergence trade setup is used as a possible signal for a price trend reversal & it is used by XAUUSD traders when looking for an area where price could reverse and begin going in the opposite trend direction. For this reason this classic divergence trading pattern is used as a low risk entry technique and also as an accurate way of exiting out of an opened Gold trade.
This classical divergence trading strategy offers a low-risk approach to initiating sales near peaks or purchases near troughs, thus minimizing the potential risk exposure relative to the possible reward. Nevertheless, it is a method prone to generating numerous false signals (whipsaws), leading many traders to advise against its solitary use.
The classic divergence pattern in XAUUSD trading is also employed to forecast the optimal exit point for an executed transaction. If you currently hold a profitable position, a reliable method to identify a profit-taking zone would be to observe the point where this divergence trading setup occurs.
There are two primary classifications of classic divergence, differentiated by the underlying direction of the Gold price movement:
- Classic Bullish Divergence Trading Setup
- Classic Bearish Divergence
Classic Bullish Divergence Trading Setup
A classic bullish divergence pattern happens when the price makes lower lows, but the technical indicator shows higher lows. The example below shows what this setup looks like in action.
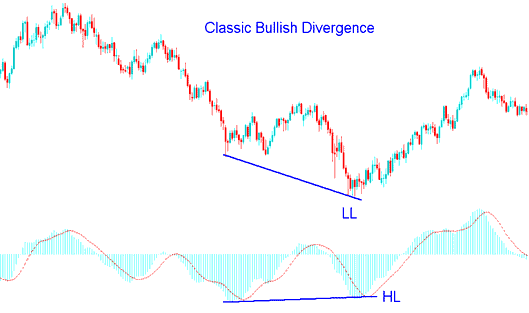
Classic Bullish Divergence Trade Setup - Gold Trading Chart
The example above uses MACD indicator as a divergence indicator.
In the example above, the price went to a lower low (LL), but the technical indicator went to a higher low (HL). This shows there's a difference between the Gold price and what the indicator is showing. The signal suggests the price trend might change direction.
A common example of bullish divergence signals a possible shift in XAUUSD's price movement from downward to upward. This occurs because, despite the continued decline in price, selling pressure diminishes significantly when comparing two troughs. This is often confirmed through indicators like the MACD.
This observation suggests underlying weakness persisting within the downward trend of the Gold price.
Classic Bearish Divergence Trading Setup
A classic bearish divergence occurs when price action forms a higher high (HH) while an oscillator indicator registers a lower high (LH). The example illustration provided showcases this typical bearish divergence setup on a chart.
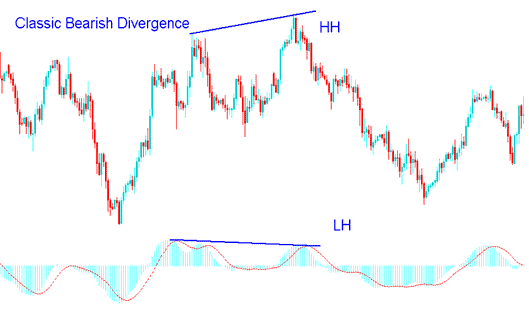
Classic Bearish Divergence Trade Setup - Gold Chart
The above example also uses MACD
Looking at the picture, the price made a higher high (HH) but the technical tool made a lower high (LH), showing a difference between the Gold price & the tool. The signal suggests the market trend might change direction.
The classic bearish divergence signal indicates that the Gold price trend might change from going up to going down. This is because even though the price increased, the amount of buying that pushed it up was lower, as shown by the MACD indicator.
This pattern suggests an underlying deterioration in the momentum of the rising Gold price trend.
In those examples up top, classic divergence setups gave strong entry or exit cues. They timed trades just right. But like other tools, divergence can fake you out. Always check signals with extras like RSI or moving averages. Add the Stochastic Oscillator too. Confirm before you enter a spot.
A suitable indicator to complement classic divergence trading patterns is the stochastic oscillator: one should then await the stochastic indicator lines to move in alignment with the divergence trading signal to confirm the trade entry.
Another good indicator to use with this setup is the moving average MA indicator: with this indicator, a gold trader should use the Moving Average Crossover System to be sure about the trade signal that comes from the divergence trading setup.
Explanation of Moving Average Cross over Method
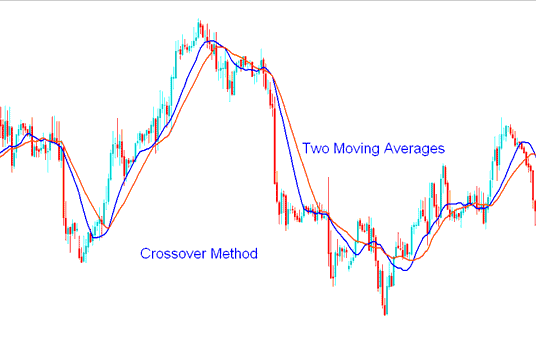
Moving Average Crossovers Paired with Standard Divergence for Trades
Upon the generation of a divergence signal, a trader should then wait for confirmation from the Moving Average (MA) crossover mechanism aligned with the same market direction. When a classic bullish divergence signal is present, the trader seeks a corresponding upward crossover signal from the moving average method. Conversely, following a classic bearish divergence signal, the trader should patiently await the Moving Average (MA) crossover system to present a signal indicating a downward, bearish cross.
By mixing the classic divergence signals with other technical indicators in this way, a trader can avoid false signals when trading classic divergence signals, because the trader will wait for the market to actually change direction and start moving toward the direction of the signal that was created: because of this, the trader won't fall into the trap of guessing market highs and lows by making trades before the actual divergence trading setup has been proven.
Get More Tutorials:
- Download Guide for XAU/USD on MetaTrader 4
- US30 Index Market Opening Hours Explained
- NZDCAD System NZD/CAD Trading Method
- Trade Double Tops and Double Bottoms Stock Index Trading Strategy with Bollinger Band Trend Reversal Setups
- Listing of Strategies for trading FRA 40 and List of FRA40 Trading Methods
- Day Trade Equity Management & Equity Management Methods
- NZD/JPY Spread Overview
- Study of Fundamental Forex Principles and Trading Psychology
- Analysis in Index Trading
- Key Considerations When Evaluating Forex Brokers for Success