How to Draw XAU/USD Fibonacci Retracement Levels on MT4 Platform Software
To figure out price pullbacks on a gold chart - like on MT4 - you use the Fibonacci retracement tool. You can see how it looks in the screenshot below.
If you want to study some Gold price charts using this tool, it's already available in the MT4 software: here's how to add it to the MT4 Platform Software. In MT4, this Fibonacci retracement tool will automatically draw the retracement levels on a price chart after you put this indicator on the Gold price chart.
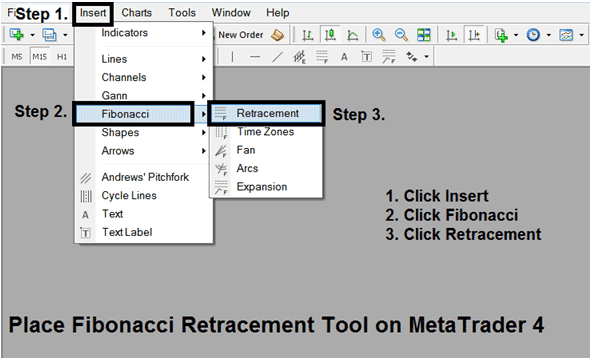
Add this tool to MT4 with this quick shortcut method.
- Click Insert
- Click Fib
- Press Retracement
Once you add the Fibonacci retracement tool in MT4, you'll find it under the “MT4 Line Studies Tool Bar,” just like you see below.
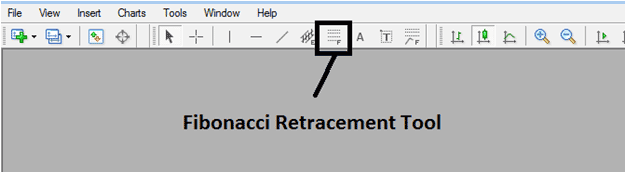
This Fib retracement indicator is located on MetaTrader 4 ("Line Studies Tool Bar"), to go to this toolbar click "View" on the top left corner of MT4 next to file, then press "ToolBars", Then Check "Line Studies". You can learn how to use Fibonacci retracement indicator on the MT4 using a demo demo account.
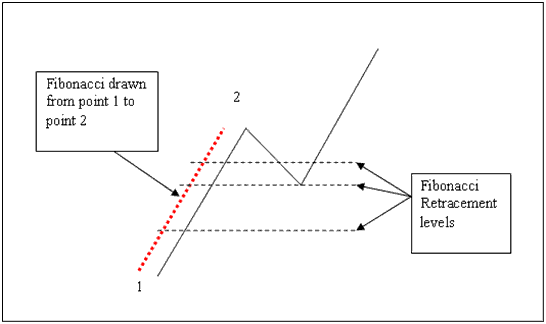
See the Fib retracement tool below. Draw it from point one to point two, along the gold trend as shown.
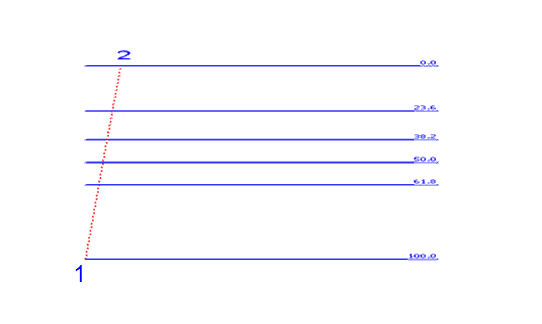
Fib Retracement Levels
How do you draw Fibonacci retracement between two points?
How to Add Fib Retracement on a Gold Price Chart
To add Fib retracement on MT4, click the tool button above. Pick two points on the chart. First is the trend start. Second is the pullback point.
To adjust this technical indicator just double-click on it and adjust points will appear on the point 1 & 2 - revealed as small squares, click and hold your mouse button to move the points to where you as a trader want them to be placed precisely. You can practice using this Fib Retracement Levels tool by using a practice Gold demo account.
Discover More Manuals & Training:
- Setting Up MetaTrader 5 for XAUUSD
- Forex Trading Strategy Rules for Generating Buy FX Signals and Sell Trading Signals
- Methods for Analyzing Trading Strategy Signals
- Demark Projected Range MT5 Technical Analysis
- Automatic Computer Advisor(EA) EA Robot Details
- Index Signals & Index Strategy
- Inquiry About the EUR/CAD Bid and Ask Spread
- Setting Up Bollinger Bands Forex Expert Advisor (EA)