
Reversal Setups Head and Shoulders and Reverse/Inverse Head and Shoulders
Head and Shoulders Reversal Setup
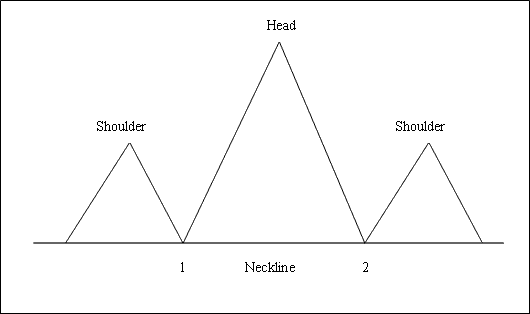
This is a reversal pattern setup formation that forms after an extended XAUUSD price upward trend. It's made up of 3 consecutive peaks, the left shoulder, the head & the right shoulder with 2 moderate troughs between the shoulders pattern.
A Head and Shoulders reversal formation is complete when the price breaches the neckline plotted by connecting the two troughs within the pattern.
To go short, XAU USD traders place their sell stop orders just below the neckline.
Summary:This reversal setup forms after an extended move upward
This setup reflects that there'll be a reversal in the market
This setup resembles and looks like head with shoulders thus its title.
To create the neckline, we utilize chart point 1 and point 2 as illustrated below. Additionally, we extend this line in both directions.
We initiate a sell when the price breaks below the neckline: refer to the chart below for clarification.
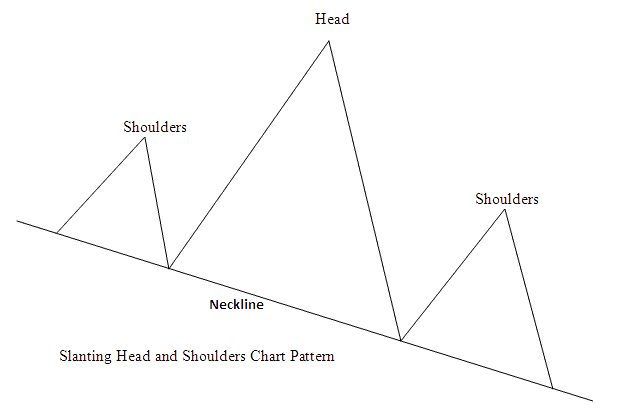
Alternatively, the head and shoulders formation can manifest with an inclined neckline, as illustrated underneath:
Explanation of Head Shoulders Setup on a XAU/USD Price Chart
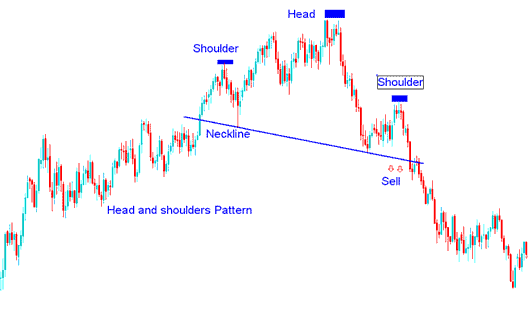
Head & Shoulders Setup
This reversal pattern can form on a sloped neckline too, like the one shown. The neckline does not need to be flat.
Reverse Head and Shoulders Reversal Pattern
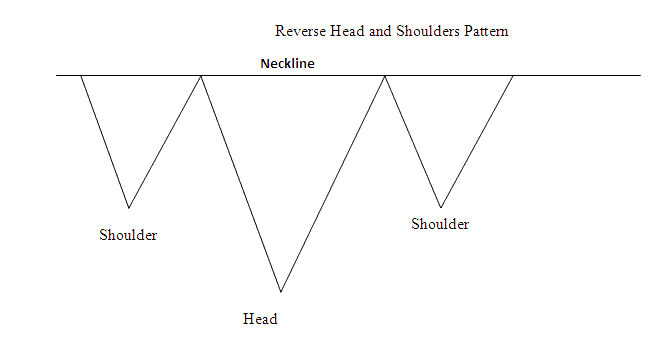
This head and shoulders setup happens after a long XAUUSD fall. It looks like a head & shoulders pattern turned upside down.
This Head and Shoulders Reversal Pattern is regarded complete once the price penetrates above the neckline, which is plotted by joining the two peaks between the reverse head and shoulders pattern.
To go long buyers/bulls place their buy stop orders just above the neckline.
Summary:This reversal setup forms after an extended move downward
This setup shows a market turn is coming.
This configuration resembles an inverted head and shoulders pattern, hence its designation as Reverse.
Buy when price crosses above the neckline, as shown in the chart.
Explanation of Reverse/Inverse Head and Shoulders Setup on a XAU/USD Price Chart
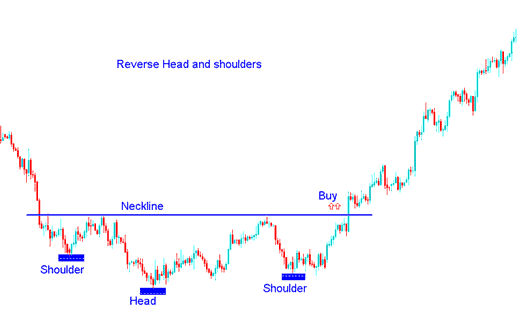
Reverse Head and Shoulders Setup
Pick up new lessons and courses
- Forex FTSE 100 Index FTSE 100 Quote in FX
- Forex DeMarks Projected Range EA EA Setup
- What Time Does DJ30 Index Open?
- What's SMI20 Indices MT4 Chart?
- How to Include FTSE in the MetaTrader 4 Phone App?
- How to Find and Get SMI 20 in MetaTrader 5 PC
- How Do I Put GER30 on MT5 Software?
- Customizing and Arranging Charts Toolbars in MT4 Trade Platform
- How to Write a Forex Trade Plan Example
- Brokers with FX Trade Accounts Requiring Low Deposit