Drawing Downward Trend Lines & Channels
A downward trend line on a Gold trading chart is drawn when prices show an overall downward trajectory, connecting at least two peaks of the declining price trend above these lower prices. This line indicates that the overall price trend is downward.
The example illustration below explains this concept & explains how the prices move when in a downward trend. When the market is moving downwards it keeps forming new resistance zones as it moves downward and these resistance zones are the ones used to draw the downward trend-line.
Markets move in zigzags, so draw a trend line. It captures the overall down direction.
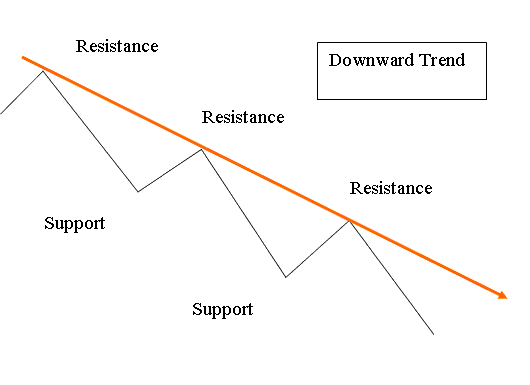
Downwards Trending Market
A downward trend happens when the price of Gold makes a pattern of going lower and lower. Each high point is less than the one before it, and each low point is also less than the one before, which shows that prices are going down.
Downward trend lines get stronger every time price tests them but can't break through. The downtrend sticks around until you stop seeing lower highs and lower lows.
In technical analysis, a bullish signal is indicated by the upward break of a downward trend line, suggesting that a reversal or consolidation of the bearish XAUUSD Gold prices may soon happen.
Drawing a Downward Trend-Line
When the XAUUSD market drops, it forms lower lows and lower highs - that's a bearish trend. You can draw a downtrend line by connecting these lower highs.
In order to illustrate this setup, we utilize resistance zones established by the prices. To accurately draw a downward trend line, two resistance zones are required. When the price tests or touches this downward trend line, we proceed to buy and place a stop loss order just a few pips above this trend line. The diagram below provides an example of a downward trend line.
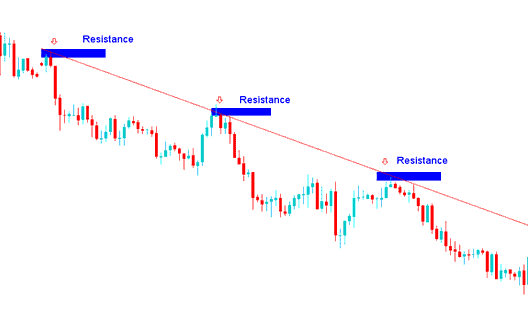
Downwards Trend Line - XAU USD Trading
The trend line setup will show that the Gold market is generally going down, so traders will only sell when the price stays within this setup and the resistance zones. These are the spots where the price goes back, and these areas will give strong and major resistance for the price. This is why many sellers will wait for the price to go up and touch these levels before they start selling. Trades at these levels have a very high chance of success and are very profitable.
In the above setup the gold trader would have opened sell/short trade transactions from the trading signals generated/derived at the resistance1, resistance2, resistance3 & these trade transactions would have made a lot of profits with minimum amount of drawdown/retracement. This is why many traders like to trade using this trend line trading setup.
Drawing Downward Channel
A channel that goes down is made by drawing a line that goes the same way as the downward trend-line, and then this line is moved to touch the bottom of the price movement. This makes a channel for the price, and as long as it stays between these channels, the price of Gold will keep going down.
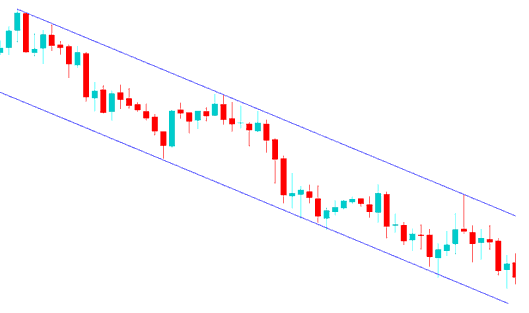
Downward Channel Pattern in XAUUSD Trades
the Downward Gold Prices Channel
XAUUSD traders use this downward channel to spot profit-taking levels. They sell some when price hits the lower channel. Then wait for a pullback to enter another sell trade.
MT4 Tools for Drawing Downward Trendline and Channels
Tools for drawing setups in MetaTrader 4 sit on the drawing toolbar in the platform software. To turn it on if hidden, click View next to File at the top left in MT4. Then select Toolbars. Check the box for Lines Toolbar.
Below, you'll see a screenshot of the MT4 trend lines toolbar. To draw a trend line on a XAUUSD chart, just click the tool and choose your starting point.
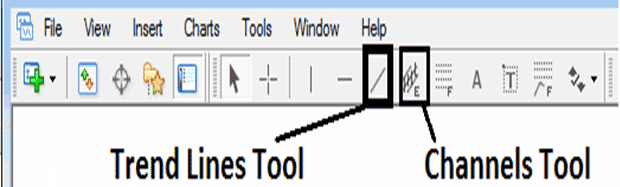
MT4 ToolBar for Drawing Downward Trendline and Channels
Explore Further Subject Areas & Training:
- Using the Balance of Power (BOP) Indicator on the MT4 Platform
- FTSE MIB Guide Index FTSEMIB 40 Stock Index Trading Strategy Lesson Tutorial
- Understanding Multiple Time Frame Analysis in Forex Trading
- A Trade Strategy for the DJI 30 Indices
- XAU USD Metal Trade
- Best Time to Trade GBPUSD Start Time & End Time
- Bollinger Percent B or Bollinger %b MetaTrader 4 Trading Indicator
- Which Online Broker Can You Use to Trade DAX 30?
- How to Figure Out What FX Pending Orders Mean