Commodity Trade Head and Shoulders Chart Patterns
A Head & Shoulders pattern is a bearish trend reversal signal which signals the current upward commodity trend is about to reverse once the Head & Shoulders chart pattern is confirmed.
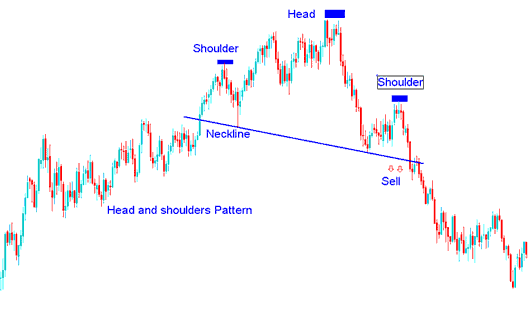
The Head & Shoulders chart pattern is a pattern with three consecutive highs where second high is slightly higher than the first & third high which signals the upward trend is losing momentum & if the commodity price of the commodity pair falls below support level which is two lows between the three highs then the Head and Shoulders chart pattern is considered completed and the commodity price of the commodity pair changes to a bearish trend.
Commodity Trade Head and Shoulders Chart Patterns