Commodity Trading Interpret Reverse Head and Shoulders Chart Patterns
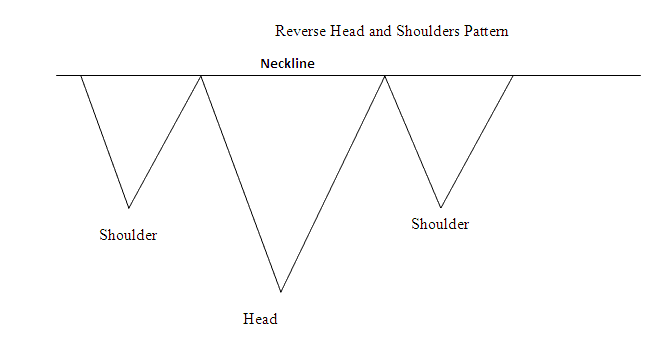
A Reverse Head and Shoulders chart pattern is a bullish trend reversal trading signal which trading signals the current downward commodity trading price trend is about to reverse once the Reverse Head and Shoulders chart pattern is confirmed.
The Reverse Head & Shoulders chart pattern is a pattern with three consecutive lows where the second low is slightly lower than the first & third low which signals the downward commodity trend is losing momentum and if commodity trading price of the commodity pair rises above resistance level which is two highs between the three lows then the Reverse Head and Shoulders chart pattern is considered confirmed and price of the commodity pair changes to a bullish trend.
Commodity Trading Interpret Reverse Head and Shoulders Chart Patterns