What Does a Double Tops Chart Pattern Look Like?
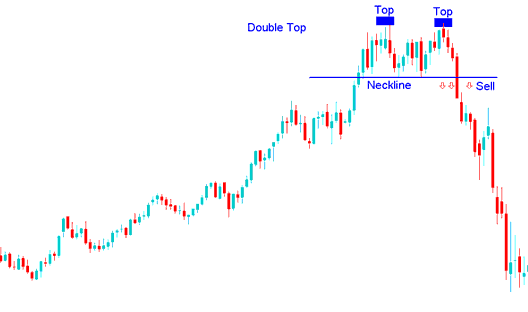
Example of Double Tops Chart Pattern
Double Tops Chart Pattern is a Bearish CFDs Pattern - Double Tops Pattern is a Bearish CFD Signal Pattern
Summary:
- Double tops cfd chart pattern forms after an extended move upward - upwards cfd trend
- Double tops cfd pattern signal indicates that there will be a reversal in the cfd market trend
- We sell when price breaks-out below neckline: as described on the cfd examples explained and illustrated below.
Analysis of Double Tops Chart Pattern in CFD?
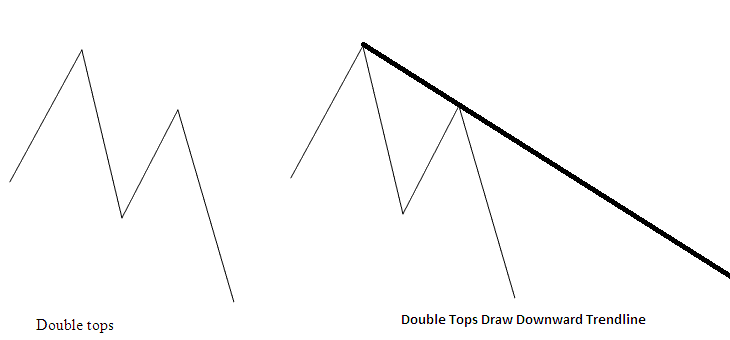
Double tops cfd pattern look like an M-Shape pattern, the best reversal cfd signal from double top chart pattern is where the second top is lower than the first top as shown and illustrated below:
This means that the reversal cfd signal can be confirmed by drawing a downwards cfd trend line as shown below. If a trader opens a sell cfd trade using this double tops reversal cfd signal the stop loss will be placed just above this downwards trend line.
Analysis of Double Top Chart Pattern - Examples of Double Tops Pattern


