Analyze a Flag Pattern
There are two types of cfd flag chart patterns - bullish flag chart pattern and bearish flag chart pattern.
To trade these cfd chart patterns a trader requires to learn about the technical analysis of bullish flag chart pattern and bearish flag trading pattern.
Bull Flag Chart Pattern
This bull flag chart pattern forms what looks like a rectangle. The rectangle is formed by two parallel lines that act as support and resistance for the cfd price until the cfd price breaks-out. In general, the bull flag chart pattern will not be perfectly flat but it will be sloping.
The bull flag chart pattern is found within a CFD upward trend. In this bull flag chart pattern is a continuation chart pattern where the cfd market retraces slightly, it is therefore a slight retracement with narrow cfd price action which has a slight downwards tilt. The technical buy point is when price penetrates the upper line of the bull flag chart pattern. The flag portion has highs & lows which can be connected by small lines which are parallel, and it looks like a small channel.
The bull flag chart pattern occurs at halfway point of a bullish upwards cfd trend and after a break out a similar move equal to the height of the flagpole is expected.
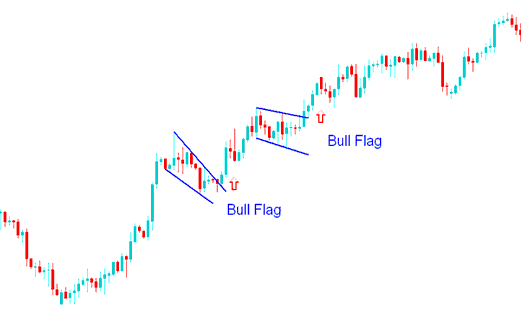
CFD Trade a Bull Flag Chart Pattern in CFD?
The bull flag pattern above was just a resting period as the cfd market gathered strength to break out & move higher. The bull flag chart pattern cfd continuation cfds trading signal was confirmed as a upper line of this flag pattern was broken to the up side.
Bear Flag Chart Pattern
This bear flag chart pattern is found in a CFD downward cfds trend. The bear flag chart pattern is a trend continuation pattern where the price retraces slightly with a narrow price action which has a slight upward tilt. The technical sell point is when the price penetrates the lower line of the inverted bear flag chart pattern. The flag portion of this cfd chart pattern has highs and lows which can be connected by small lines which are parallel, and it looks like a small channel.
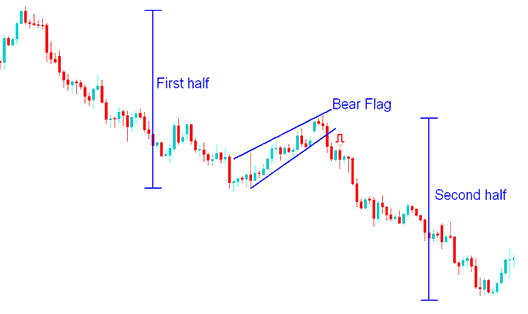
CFD Trade a Bear Flag Chart Pattern in CFD?
The bear flag chart pattern above was just a resting period for the cfd market prior to more selling. Continuation cfds trading signal was confirmed when the lower line of this pattern was broken to the downside.


