When Does a CFD Trend Start?
Steps to Identify a Beginning CFD Trend - How to Identify Starting Trends in CFD with Examples
When Does a Upward CFDs Trend Start?
Guide: How to Know When a CFD Up Trend is Starting - When Does a Upward CFD Trend Start
Example of How to Know When a CFD Up Trend is Starting - When Does a Upward CFD Trend Start
When Does a Downward CFDs Trend Start?
Tutorial: How to Know When a CFD Down Trend is Starting - When Does a Downward CFD Trend Start
Example of How to Know When a CFD Down Trend is Starting - When Does a Downward CFD Trend Start
The cfd trend is your friend. Is a popular saying among cfd traders because you should never go against the cfd trend when trading cfd. This is most reliable method to trade CFD because once prices begin to move in one specific direction they can move in that direction for quite some time - therefore using this trend technique presents opportunity to make profits from the CFD market.
Principles of How to Draw CFDs Trend Lines
Use candle-stick charts to draw cfd trend lines
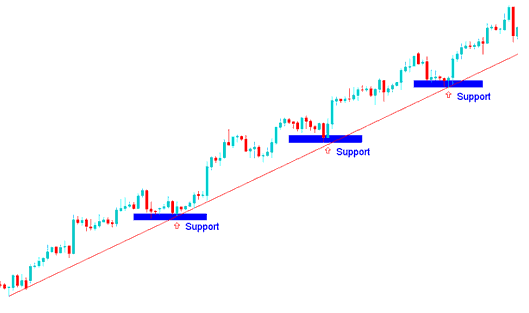
- The points used to plot the trend line - upwards cfd trendline are along the lows of the cfd price bars in a bullish cfd market. An upward bullish cfd trend is defined by higher highs and higher lows.
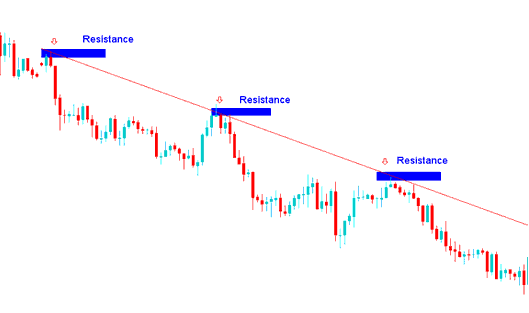
- The points used to plot the trend line - downwards cfd trend-line are along the highs of the cfd price bars in a bearish cfd market. A downwards bearish cfd trend is defined by lower highs & lower lows.
- The points used to draw the trend lines are extremes points - the high or the low cfd price. These extreme cfd price points are important because a cfd price close beyond the extreme tells traders the cfd trend of cfd might be changing. This is an entry or an exit cfd trade signal.
- The more often a cfd trend line is hit but not broken, the more powerful its cfd trend signal.


