Technical Analysis of Head and Shoulders Chart Patterns
Trading CFD Analyze Head and Shoulders Chart Patterns
Head & Shoulders Trading Pattern
Head & Shoulders Pattern is a reversal chart pattern which forms after an extended CFD upward trend.
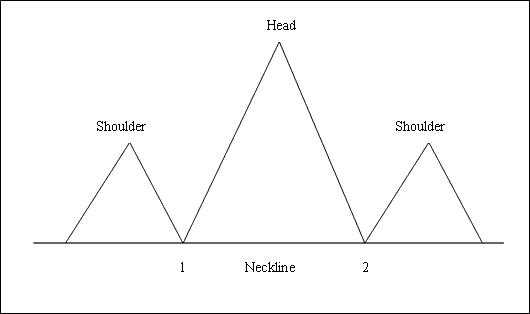
Head & Shoulders Pattern is made up of three consecutive peaks, the left shoulder, the head & the right shoulder with two moderate troughs between the two shoulders.
This Head and Shoulders Pattern is considered complete once cfd price penetrates & moves below the neck line, which is plotted by connecting these two troughs in between the shoulders.
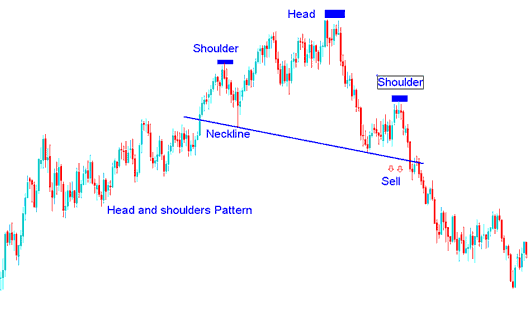
To open a sell cfd trade after this reversal cfd signal, CFD traders place their sell stop orders just below the neck line region.
Summary:
- This Head and Shoulders Chart Pattern forms after an extended move upward - cfd upwards trend
- This Head & Shoulders Pattern formation indicates that there will be a reversal in cfd market
- This Head & Shoulders Pattern formation resembles a head with shoulders thus its name.
- To draw the neckline we use chart point 1 and point 2 as illustrated on the cfd example explained and illustrated below. We also extend this line in both directions.
- We sell when price breaks-out below neckline: as described on the cfd examples explained and illustrated below.
Analysis of Head & Shoulders Chart Patterns?
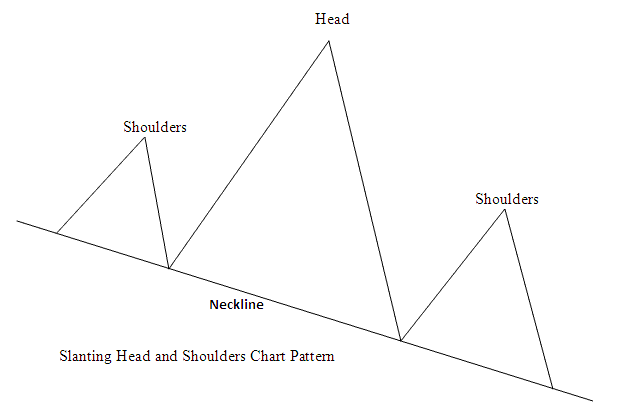
Or the head & shoulders pattern can also form on a slanting neckline, like the cfd examples explained & illustrated below:
Analysis of Head & Shoulders Chart Patterns?
Examples of Head & Shoulders CFD Pattern on a CFDs Chart
Analyze Head & Shoulders Chart Patterns?
This Head & Shoulders Pattern can also be formed on a slanting neckline, like the head & shoulders pattern examples above, neck line does not have to be necessarily horizontal.


