What is Double Tops Cryptocurrency Chart Patterns in Bitcoin Trading?
Trading Cryptocurrency Identify a Double Tops Trading Pattern in Bitcoin Trading
The Best Trading Patterns Tutorial for Beginners - How to Identify and Trade Double Tops Bitcoin Chart Pattern
Bitcoin Chart Patterns for Day Trading - Bitcoin Patterns Explained
This Double Tops patterns charts tutorial explains how to identify cryptocurrency chart patterns - identifying cryptocurrency patterns is the first step when it comes to learning how to bitcoin trade with Double Tops cryptocurrency chart patterns in Bitcoin.
Double Tops bitcoin price patterns commonly form on Bitcoin Trading charts & this cryptocurrency pattern analysis tutorial explains how to trade and analyze crypto charts using Double Tops cryptocurrency chart patterns.
Double Top Bitcoin Chart Pattern
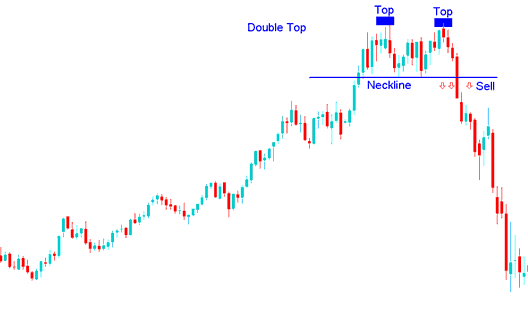
Double tops cryptocurrency chart pattern is a reversal bitcoin pattern that forms after an extended upwards cryptocurrency trend. As its name implies, this double top cryptocurrency pattern formation is made up of 2 consecutive peaks which are roughly equal, with a moderate trough between.
This double tops cryptocurrency pattern formation is considered complete once bitcoin price makes second peak & then penetrates lowest point between highs, called the neck line. The sell cryptocurrency signal from this double top cryptocurrency pattern formation occurs when the btcusd trading market breaks-out below neck line.
In Bitcoin, this double tops cryptocurrency pattern formation is used as a early warning signal that a bullish Bitcoin trend is about to reverse. However, double top cryptocurrency pattern is only confirmed once the neckline is broken and the btcusd trading market moves below neckline. Neckline is just another name for the last support level formed on the Crypto chart.
Summary:
- Double tops bitcoin pattern forms after an extended move upwards
- This double tops cryptocurrency pattern formation indicates that there will be a reversal in btcusd trading market
- We sell when bitcoin price breaks-out below neck-line: see below for the explanation.
What's Double Tops Cryptocurrency Chart Patterns in Bitcoin Trading?
The double tops cryptocurrency chart pattern look like an M Shape, the best reversal cryptocurrency signal is where the second top is lower than the first one as shown below, this means that the reversal cryptocurrency signal can be confirmed by drawing a downwards bitcoin trend line as shown below. If a trader opens a sell cryptocurrency signal the stop loss will be placed just above this downward bitcoin trend line.
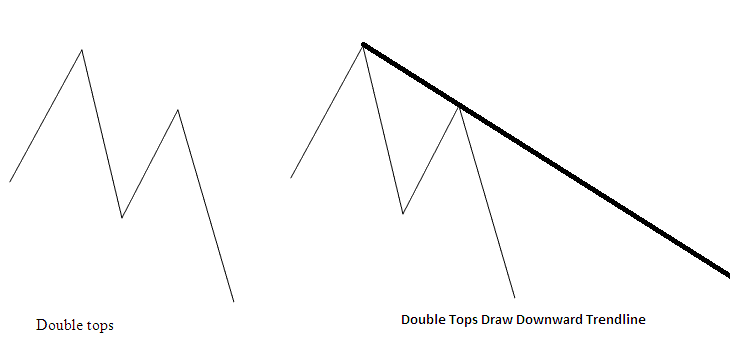
M Shaped Double Tops Bitcoin Chart Pattern - What is Double Tops Cryptocurrency Chart Patterns in Bitcoin Trading?


