True Strength Index Bitcoin Analysis & TSI Signals
TSI Indicator
Created by William Blau
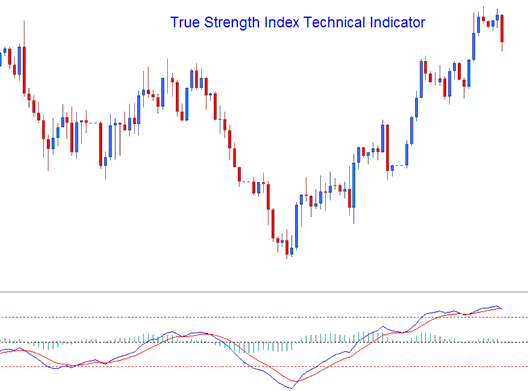
True Strength Index is a tool that measures momentum. The TSI is created using a momentum formula that responds more quickly and is more sensitive to changes in bitcoin's price: this makes it a leading tool that closely tracks the direction of bitcoin's price in the bitcoin market.
The TSI appears as a blue line. A red signal line crosses it to create buy or sell alerts.
The TSI also generates a histogram that depicts the difference between the TSI Line and the Signal Line. This histogram fluctuates above or below the centerline: levels above the centerline indicate a bullish crossover signal, while levels below the centerline signify a bearish crossover signal.

BTCUSD Analysis & Generating Signals
The TSI employs a variety of techniques and methods to produce cryptocurrency signals. This indicator can be utilized similarly to the RSI to determine the overall trend direction of Bitcoin prices. Additionally, TSI can illustrate overbought and oversold levels. The most common methods for generating trading signals include:
Zero Line Histogram Crossover for BTCUSD Trades, Not Lines
- Buy - when the histogram crosses above 0 a buy is generated
- Sell - when the histogram crosses below Zero a sell signal is generated

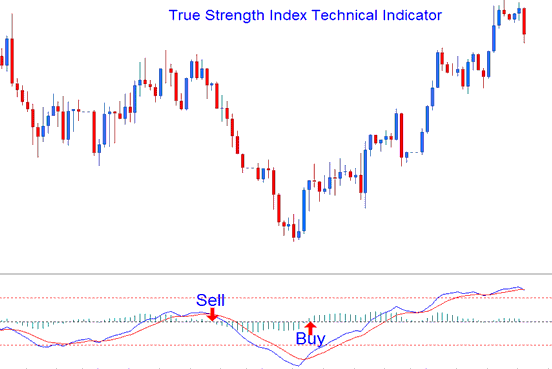
Bitcoin Signal line BTCUSD Trading Crossover
- A buy is generated when the TSI line crosses above Signal-line
- A sell is generated/derived when the TSI line crosses below Signal Line
This signal is the same as the one above, and it happens at the same time as when the histogram crosses over.
Divergence Bitcoin CryptoCurrency Trading
The divergence setup is utilized to identify potential reversal points in the bitcoin trend. Reversal divergence setups include:
Classic BTCUSD Trading Divergence
Classic Bullish Divergence in Bitcoin trading features lower lows in bitcoin prices and higher lows on indicators.
Bitcoin Trade Classic Bearish Divergence Setup: Characterized by higher price peaks in Bitcoin and concurrently lower peaks registered by the associated trading indicator.
Divergence in trading analysis can also be instrumental in pinpointing potential stages where a bitcoin trend might continue along its existing direction in bitcoin price action. Continuation divergence scenarios include:
Hidden Bitcoin Divergence Trade Setup
Bitcoin Hidden Bullish Divergence: higher lows in bitcoin price and lower lows on the indicator
Bitcoin Bearish Divergence Identified Under the Surface: Price exhibits lower highs, whereas the indicator displays higher highs.
Overbought/Over-sold Levels on Indicator
this may be used to pick out overbought & oversold situations in bitcoin fee movement moves.
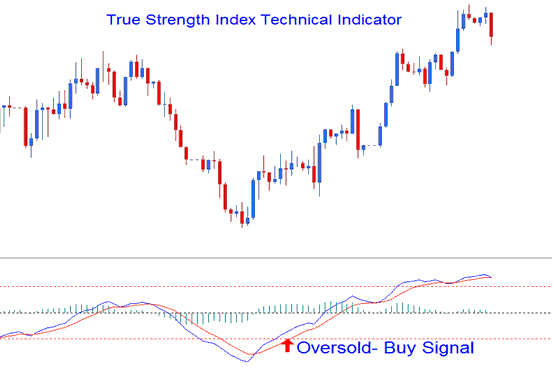
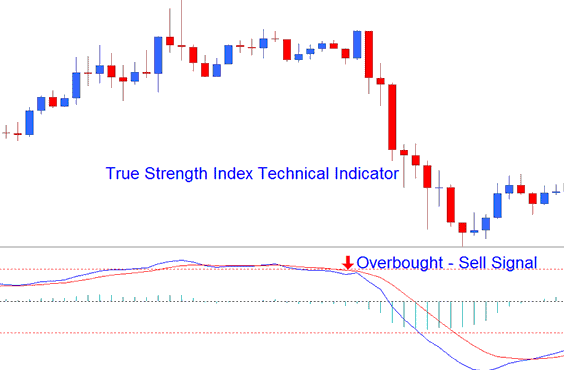
- Overbought condition - levels being higher than the +25 level
- Over-sold condition - levels being lesser than the -25 level
When TSI crosses these technical levels, trades may be created or obtained.
Buy signal happens when levels cross above -25. That creates the signal.
Sell trading signal - a sell signal is generated when the areas cross below the +25 level.

Over-sold

Overbought
The overbought/oversold levels are indicated the use of horizontal traces drawn on the +25 & -25 tiers.
Further Guides and Manuals:
- How Do You Trade BTC USD in MT4 iPad App?
- BTC USD Trade MetaTrader 5 Chart Properties on Charts Menu in MT5 Platform
- How Do I Interpret Fibonacci Pullback on Software Platform?
- How to Modify Stop Loss BTC USD Order on MetaTrader 4 Platform Software
- How to Test MQ5 Automated Bitcoin Trade Bots EA Expert Advisors
- Understanding Bollinger Percent B (%b) for Bitcoin Trading
- How Do I Interpret Chart Price Upward Trend?
- BTC USD Trade Signal Copying
- Fibonacci Extension Levels in BTC USD Charts Described
- How Do I Interpret BTCUSD Trade Candle Patterns Analysis?
