Multiple Time Frame Analysis
Multi-timeframe analysis involves utilizing two different chart timeframes for cryptocurrency trading: a shorter interval for executing trades and a longer interval for confirming the overall Bitcoin trend direction.
It's smart to follow the trend. With multiple time-frame analysis, the longer time frame shows us where the long-term trend is heading.
When long-term market flow matches your short-frame direction, wins come easier. A wrong move gets fixed by the big trend. Stick to the market's path, and you join the winners. That's the heart of this analysis.
Remember, many Bitcoin and stock market traders often say, "The btcusd trend is your friend," meaning never trade against what the btcusd trading market is doing.
There are four distinct types of Bitcoin traders, each utilizing various charts for trading, as described below.
How BTCUSD Traders Use Multiple Time Frames: Examples for Each Trader Type
Scalpers
Scalpers hold trades for just a few minutes. They close within 10 minutes max. The goal is small gains of 5 to 20 pips.
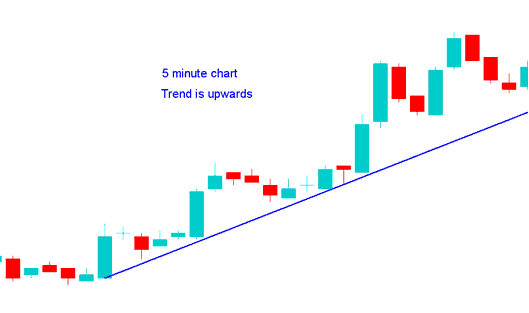
A scalper analyzing a one-minute chart may check the five-minute trading chart for confirmation. If the five-minute chart indicates an upward Bitcoin trend, they may proceed with placing a buy order based on this analysis.

Day Traders
This group keeps their trades going for a few hours but never longer than a day, aiming to make a good number of pips: from 30 to 100 pips.
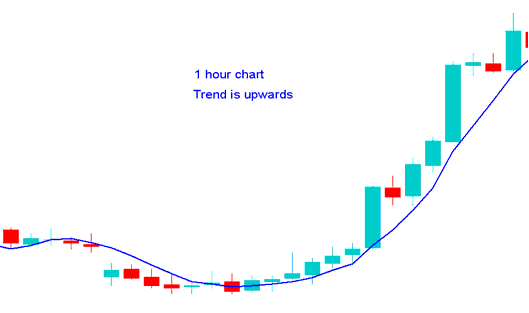
A day trader observing a 15-minute chart who intends to take a long position will examine the 1 Hour chart, similar to the depiction below. Since the 1H timeframe indicates an upward trajectory for the bitcoin trend, the trader concludes from this analysis that initiating a buy order is appropriate.

Swing Traders
This group holds trades for days to a week. Their goal is 100 to 400 pips.
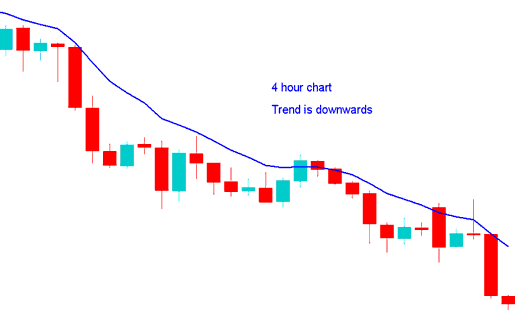
A swing trader using the H1 chart to trade for a short time checks the 4-hour chart, like the cryptocurrency trading example below, because the 4-hour chart shows the btcusd trend is going down, so they decide it's okay to sell based on this information.

Position traders
These traders hold positions for weeks or months. They aim for 300 to 1000 pips in profit.
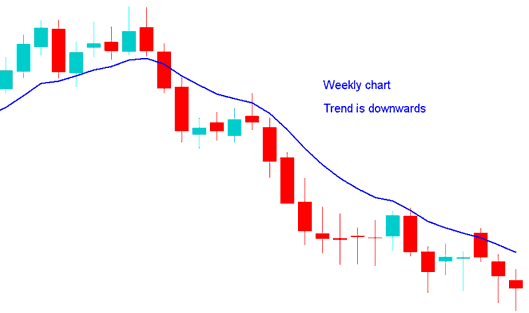
A trader who holds positions for longer using the daily chart wants to sell, looks at the weekly chart, and the weekly chart is similar to the one shown: because the weekly chart shows the bitcoin trend is going down, they decide it is okay to sell based on this study.

How to Define A BTCUSD Trend
A bitcoin trading strategy uses three things: a system that crosses Moving Averages(MA), RSI & MACD, and it follows simple rules to figure out which way the trend is going. These are the rules:
Upwards trend
Both MAs Moving Up
RSI above 50 Level
MACD Above Center Line
Down-ward BTCUSD Trend
Both MAs Moving Averages Moving Down
RSI below 50 Level
MACD Below Centerline
For More details & particulars about this strategy read: How to Generate Bitcoin Signals with a Bitcoin System.
More Courses & Tutorials:
- Description of the Head and Shoulders Pattern Using BTC USD Candlesticks
- Criteria for Selecting the Optimal MetaTrader Trading Software Environment for Bitcoin Trading?
- MT4 Platform Trading Course: Chart Analysis for Beginners
- How Do You Set Up CCI in a Chart?
- How Can You Study/Understand BTC/USD Channel Tool on BTCUSD Charts?
- BTCUSD Apps
- BTCUSD Reversal Trade System
- Getting Started with Trade Brokers and Learning the MetaTrader 5 iPhone Application
- How can you figure out where Bitcoin is going and how strong its trend and momentum are?
- Sell Stop Orders – Real Examples for Better Understanding
