MT4 Data Window
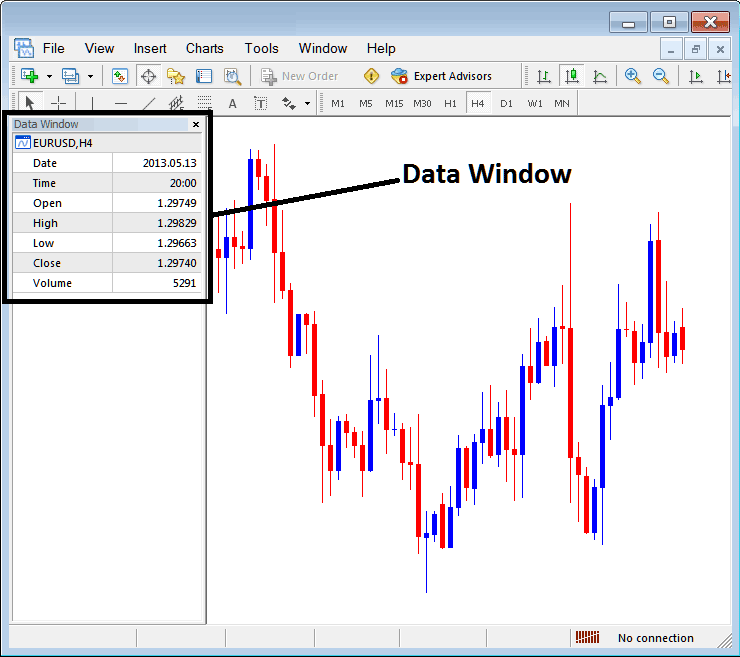
The MetaTrader 4 Data panel window displays information about a bitcoin price for a particular candlestick period. For instance, the images below demonstrate how to choose and choose the data window from the view menu selections. Ctrl+D is the shortcut key for bringing up the data window without needing to navigate the view menu.
Data Window - MT4 Bitcoin Platform

Upon activation of the data window element, it commences displaying the subsequent torrent of data pertinent to the bitcoin valuation.

The following data for bitcoin trading is displayed & shown:
- Bitcoin Chart
- Date
- Time
- Open Bitcoin Price
- High
- Low
- Close Bitcoin Price
- Volume
This displayed information pertains to a specific candlestick: as you move your mouse over the candles on a Bitcoin chart, this data updates to reflect the details of the particular Bitcoin price candlestick situated beneath your cursor.
The Data Window feature receives less utilization on the MT4 BTCUSD Crypto Platform when juxtaposed with other MetaTrader 4 chart views. Nevertheless, as a Bitcoin trader, you can leverage this data panel to extract and display particulars for any given Bitcoin price candlestick, including the corresponding opening price, closing price, as well as the high and low price points for that candle.
Most traders pull data right from charts. BTCUSD users often stick to Bitcoin chart info in the MT4 setup.
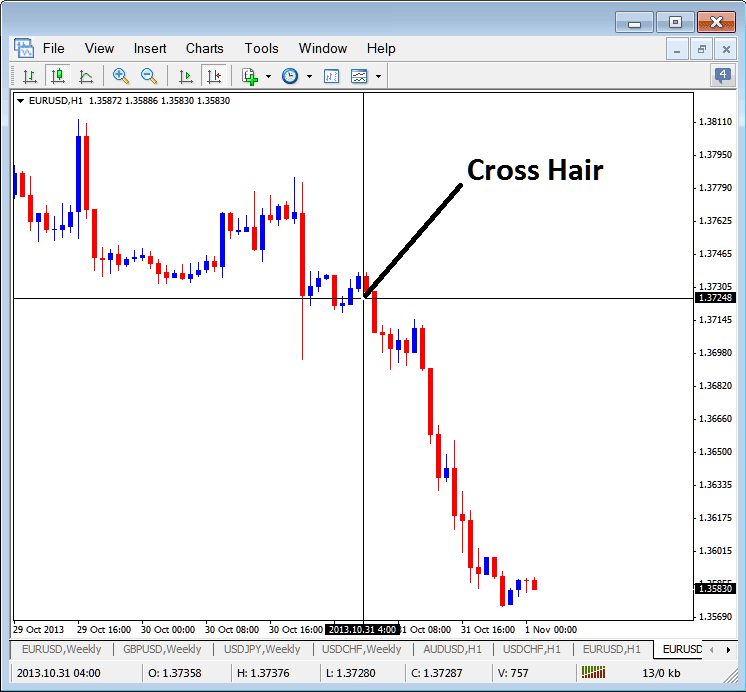
Use the crosshair tool for price data. Press and hold the mouse wheel to show it. No wheel? Get a new mouse for MetaTrader 4 trading. The crosshair reveals bitcoin prices as shown.
Cross Hair Tool - MT4 Bitcoin Software

On the chart, the cross-hair's vertical line shows the date for the current candlestick. The horizontal line marks the bitcoin price at that spot. In this bitcoin chart example, you see the date as 2013.10.31 4:00 GMT and the price for that point. Below the charts tab in the MT4 bitcoin software, it lists Open, High, Low, Close, and Volume with the date. Marked as O: H: L: C: V:. The cross-hair offers a quick way to check data without opening the Data Window in MT4.
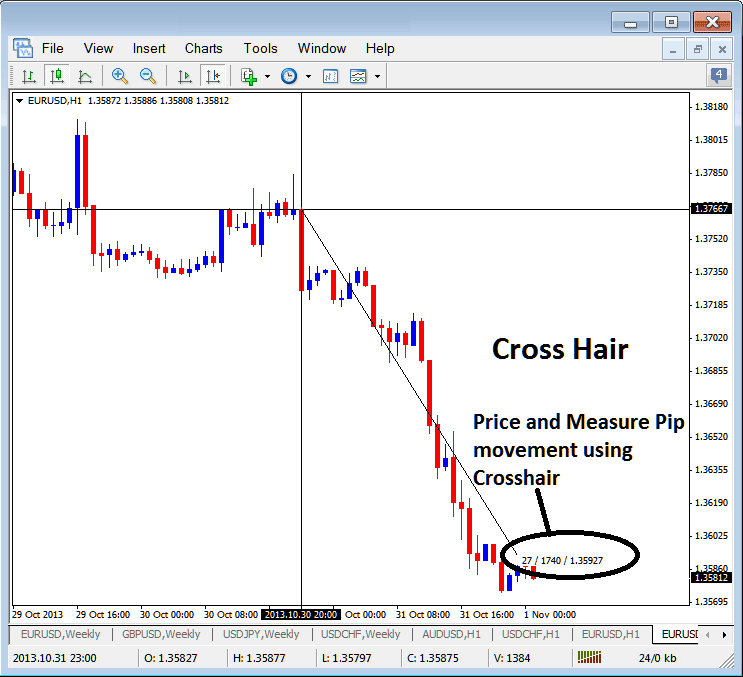
A trader can click one spot, hold the mouse button, and drag the mouse to another spot on the chart to measure how much the bitcoin price moved between those spots on the Bitcoin charts in the MT4 Bitcoin Software, as shown below.
Using Cross Hair Tool to Measure Pip Bitcoin Price Movement

Cross Hair Data Tool in MT4 Platform
Get More Lessons:
- MetaTrader No Connection MT4 Connection Bars
- How to Interpret and Analyze Bullish Reversal Doji Candle Pattern
- How Do I Interpret & Login to MetaTrader 4 Platform?
- How to Subscribe to crypto instruments Forecast BTC USD Price on crypto instruments Chart
- How to Analyze BTC USD Upward Trend Channels in BTC USD Trade
- How Do I Open a Demo MetaTrader 5 Account in MT5 Platform?
- How Do You Trade BTC USD & Draw Candlesticks Charts in MT5 Platform?
- Multiple Chart Time Frame BTC USD Strategies
- How Do I Draw Upward BTCUSD Channel in MT4 Bitcoin Charts?
- Bearish Engulfing BTC/USD Candlestick in an Up BTC USD trend
