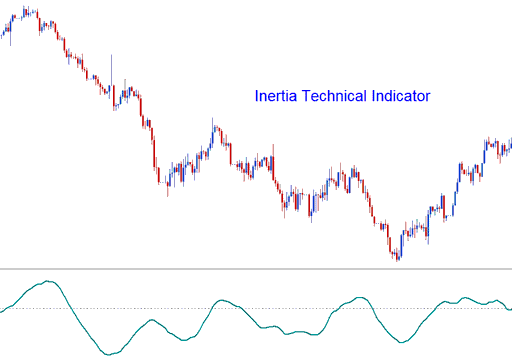
Inertia Bitcoin Analysis & Inertia Signals
Donald Dorsey created this tool for stocks and commodities. Bitcoin traders later adopted it for their market plays.
Dorsey selected the name "Inertia" based on his perception of momentum within the btcusd trading environment. He posited that the prevailing trend in a cryptocurrency market movement is fundamentally a manifestation of inertia, meaning considerable energy expenditure is required to reverse a current trend direction compared to sustaining its existing course. Consequently, a bitcoin trend serves as a quantitative measure or gauge of this market inertia. This tool is an oscillator indicator calibrated on a scale from zero to one hundred. Trading signals are generated or interpreted by observing the crossover of the 50 level centerline.

In physics, the term Inertia is defined in terms of mass and direction of motion. Using standard analysis, the direction of motion of the bitcoin trend can be easily defined. However, the mass can not be easily defined. Dorsey claimed that the volatility of a financial instrument may be the simplest & the most accurate measurement of inertia. This theory led to use of Relative Volatility Index, RVI as the basis to be used as a bitcoin trend technical indicator. Therefore Inertia technical indicator is comprised of: RVI smoothed by linear regression.
BTCUSD Analysis and How to Generate Trading Signals
When you're trading in the bitcoin market using this indicator, it's quite easy to figure out what the trading signals mean. Here are a couple of examples with charts that show how Inertia is used to come up with and make buy & sell cryptocurrency signals.
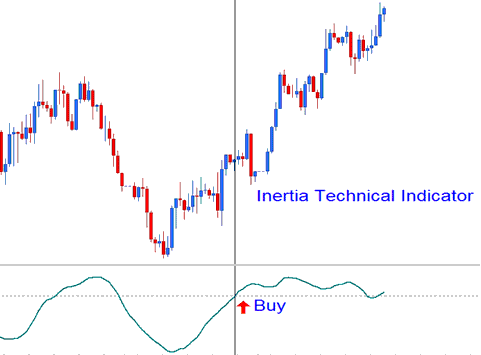
Bullish Buy Signal
Should the Inertia reading reside above the 50 mark, it signals positive momentum, effectively defining the long-term Bitcoin trend as ascending provided the indicator remains above 50. A cross below the 50 threshold is then interpreted as a signal to close any existing position. The chart beneath offers an illustrative example of how a buy signal for Bitcoin is generated.

Bullish Signal
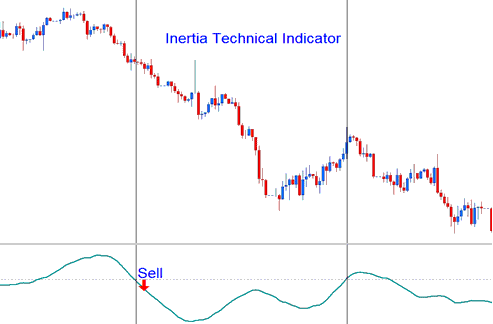
Bearish Sell Signal
An inertia measure falling below 50 suggests negative inertia, indicating a long-term downward trend in bitcoin as long as the trading technical indicator stays under 50. A move above 50 is interpreted as a sign to exit. The accompanying cryptocurrency chart illustrates a generated sell signal for cryptocurrency.

Bearish Signal
Get More Topics and Tutorials:
- MACD Indicator for BTCUSD
- Crypto Currency Trading Buy Transactions
- What is the Difference Between BTCUSD Mini and Standard BTC USD Account?
- MT4 Bitcoin Technical Indicators Insert Menu in MetaTrader 4 Insert Menu Options
- MetaTrader 5 Mobile App - Course and Tutorial
- 1-Hour BTC/USD Trend Following Strategy for Bitcoin Trading
- BTCUSD Trendline Technical Indicator MT4 Bitcoin Software
- MT4 BTCUSD Tutorial Course User Guide
- Bitcoin Trend Channel Indicator in MetaTrader 5 BTCUSD Charts
- Where to Find a BTC USD Trading Strategies Training Guide Website
