Setting Properties on Charts Menu in MetaTrader 4
The last menu item in the charts menu on the MT4 is the properties button. This button represents settings of the chart that is on the MT4 workspace. The properties button on the charts menu is shown below.
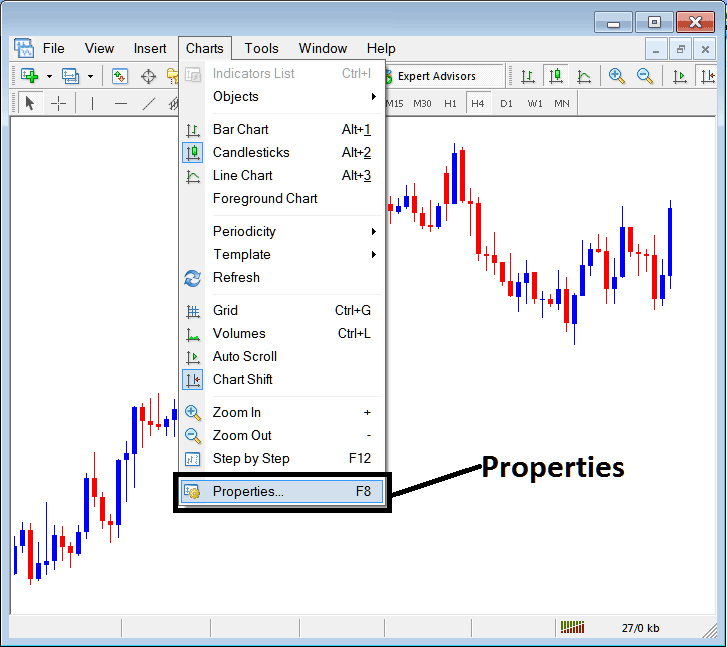
Properties Button Key in MetaTrader 4 for Editing Properties and Setting
BTCUSD Chart Properties
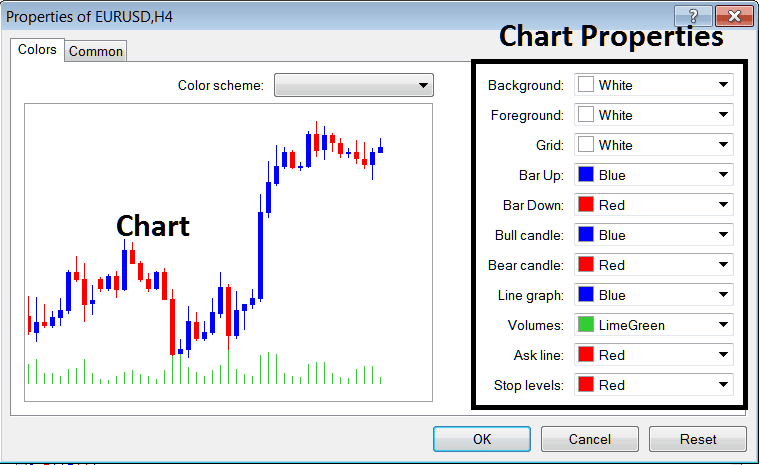
By clicking the 'properties' button key, following window pop up will appear displaying the various settings for the chart. The examples below show two examples with different settings.
Example 1:
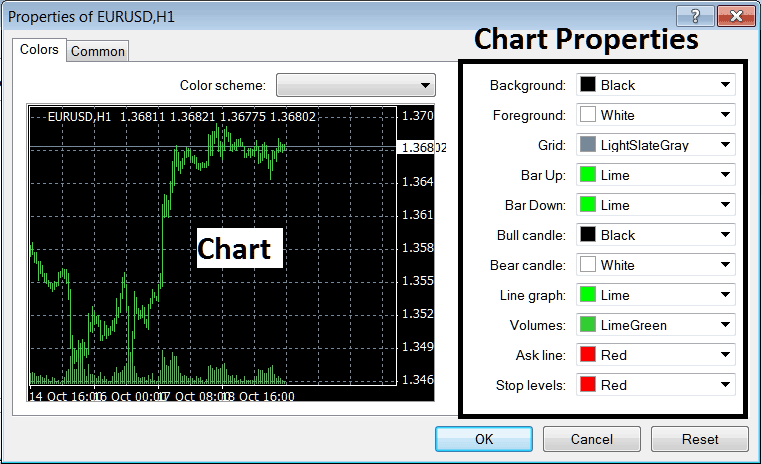
Example 2:
The following properties can be adjusted from the above menu:
- Back ground - change background
- Fore ground - change foreground, objects in the foreground
- Grid - place or remove the grid
- Bar Up - Color of bars, bullish bar
- Bar Down - Color of bars, bearish bar
- Bull Candlestick - Color of candlesticks, bullish candlestick
- Bear Candle - Color of candlesticks, bearish candlestick
- Line Graph - Color of Line
- Volumes - Setting of Volumes
- Ask Line - Setting of Ask Line
- Stop Levels - Setting of the Stop Levels Line
In the above two example these properties are different & thus the difference in appearance of these two different settings shown on preview windows above.
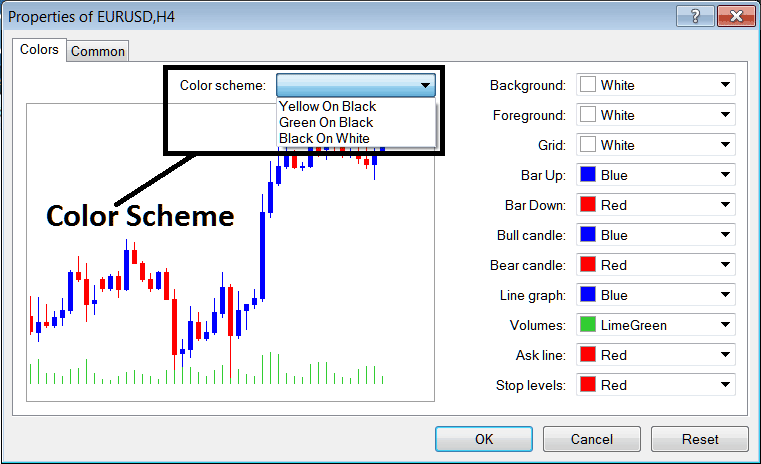
The Color Scheme
The chart properties window panel also lists 3 color scheme as shown below that traders can load & these color schemes are the default pre saved color schemes of MetaTrader 4 software.
Candles Setting
Common Settings
On properties window there's also next tab marked as "Common" as illustrated and shown below, this button key is for common settings.
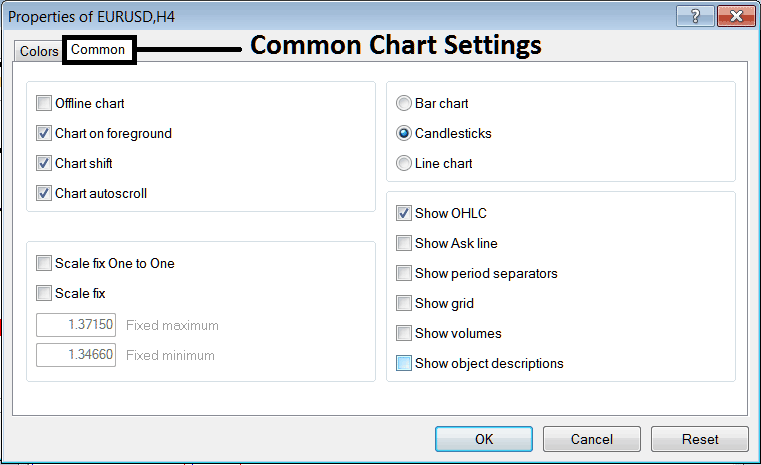
The following are The Common Settings that can be activated or deactivated using this panel:
Offline, foreground option, shift option & auto scroll properties can also be activated or deactivated from properties common settings option as shown above.
Type of chart can be chosen from this menu from the Options Bar, Candles & Line.
Show O H C L, Show ASK Line, Show Period Separators, Show Grid, Show Volumes and Show Object Description option can be activated or deactivated on this common settings option as shown above.
To learn & know more about the above setting or to find out what a particular option means or what it displays you can download the MT4 Platform & practice placing these object on charts & changing some of these properties and settings.


