McClellan Histogram Bitcoin Trading Analysis & McClellan Histogram Trading Signals
The McClellan Histogram is a graphical representation of the McClellan Oscillator and its signal line. This difference between the two is drawn as a histogram.
This is an oscillator indicator, the center line is the zero crossover mark which is used to generate buy & sell bitcoin trade signals.
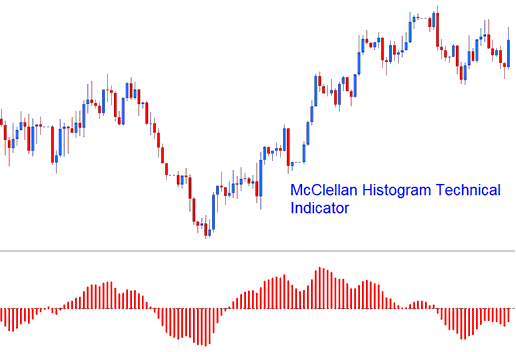
McClellan Histogram
BTCUSD Trading Analysis & How to Generate Trading Signals
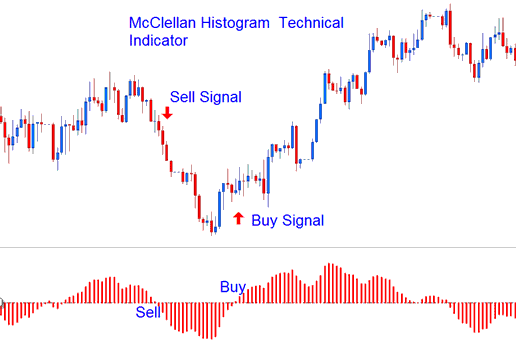
The Histogram is momentum indicator. Signals are generated using the center-line cross-over method.
- Bullish signal- Above Zero
- Bearish Signal - Below Zero
There are two fundamental techniques for using this indicator to generate trade signals.
Zero-Level Crossover- When the histogram crosses above zero a buy cryptocurrency signal is generated. Otherwise, when the histogram oscillator crosses below zero a sell bitcoin trade signal is generated.
Technical Analysis in BTCUSD Trading
Divergence Bitcoin Trading - divergence trading between this indicator & the bitcoin trading price chart can prove to be very effective bitcoin trading strategy in identifying potential bitcoin trend reversal cryptocurrency signals and bitcoin trend continuation signals.
There are several types of BTCUSD Trading Divergence Bitcoin Trading Signals:
Bitcoin Trend Reversal Signals - Classic Divergence Signals
- Bitcoin Trading Classic Bullish Divergence Signals - Lower lows on bitcoin price chart & higher lows in the McClellan Histogram
- Bitcoin Trading Classic Bearish Divergence Signals - Higher highs on bitcoin price chart and lower highs in the McClellan Histogram
Bitcoin Trend Continuation Signals - Hidden Divergence Signal
- Bitcoin Trading Hidden Bullish Divergence Signals- Lower lows in McClellan Histogram and higher lows in bitcoin trading price chart
- Bitcoin Trading Hidden Bearish Divergence Signals- Higher highs in McClellan Histogram and lower highs in bitcoin trading price chart
To Learn more about divergence go to the divergence trading topic on this website