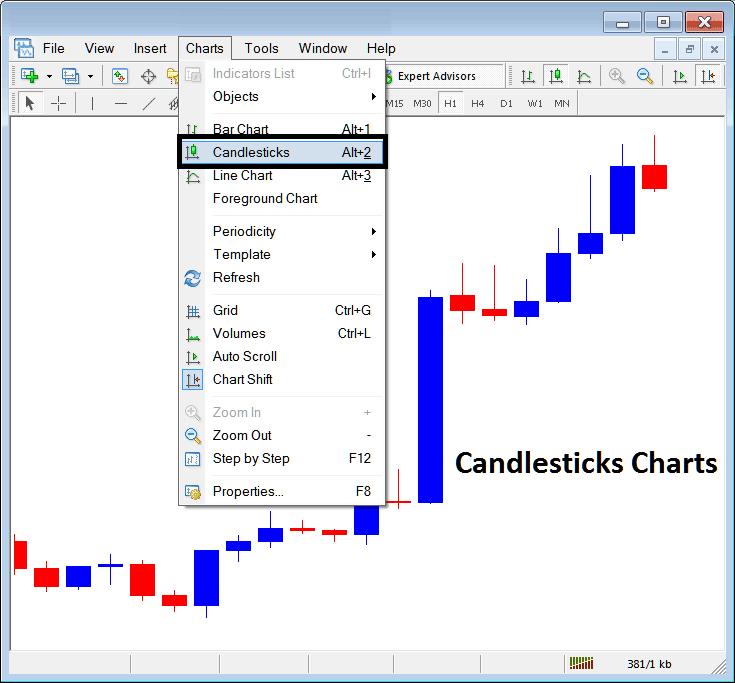
Drawing Candlesticks Charts in MT4 Platform Software
The 4th option on the MetaTrader 4 charts menu is the candles button key - used to select and choose the chart to trade with as candlesticks.

To trade with these candlesticks, the buttons above show where a bitcoin trader should click to choose this option on the platform.
These are also represented using color coding:
Red - Bitcoin Price went down
Blue - Bitcoin Price went up
A lot of traders like this chart type because it's easier to read and analyze. You can spot more trading opportunities with these charts.
This explains the Opening, High, Low, and Closing prices for any specified time segment in the btcusd market. This sequence is commonly abbreviated as OHCL.
Candle bodies show price shifts between open and close in bitcoin. They reveal key details. In the chart above, a long blue body means strong buyers. This suggests an uptrend will keep going.
The top and bottom lines on the candlestick show the highest price and the lowest price that the bitcoin trading price has reached.
Japanese Bitcoin Trading Candlesticks Guides
The Japanese patterns tutorials can be used to learn how to ascertain trend reversal signal or bitcoin trend continuation trading signals from different patterns and formations.
To gain comprehensive knowledge of the diverse bitcoin strategies applicable to trading these specific patterns, one should proceed to study these educational modules:
Educational Material on Japanese Candlesticks
Candlesticks: Marubozu and Doji Formations
Identifying and Planning for Reversal Setups
Inverted Hammer BTC USD Crypto Candle Pattern and Shooting Star Bitcoin Candle Pattern
Piercing Line Pattern in Bitcoin Candles and Dark Cloud Cover Pattern for Bitcoin
Pattern Recognition: Morning Star and Evening Star Candlesticks
Explore Further Instruction Sets & Programs:
