RSI Overbought & Over-sold Levels
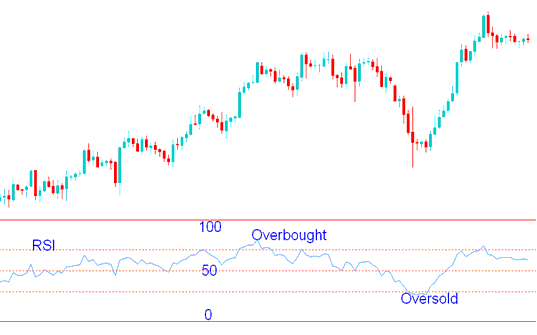
Relative Strength Index (RSI) readings exceeding 70 are conventionally deemed and treated as being in an overbought state: traders often interpret levels above the 70 mark as potential market peaks and opportune moments to secure profits.
RSI values of below 30 are regarded and considered to be over-sold: traders consider points and levels below the 30 level mark as market bottoms and good points for taking profits.
These levels, showing when something is bought too much or sold too much, need confirmation from signals that cross the RSI center line. If these zones show the market's highest or lowest point, the RSI center line crossover signal should verify this trading signal. The reason is that these levels, showing overbought and oversold conditions, tend to produce false signals in the market.
In the displayed illustration, when the RSI reached 70, it indicated overbought conditions for the currency. This signal could be interpreted as a potential trend reversal opportunity.
The currency soon reversed its trend. It dropped to oversold levels, marking a bottom. Then it climbed upward once more.
Over-bought and Oversold Levels - RSI Trading Methods
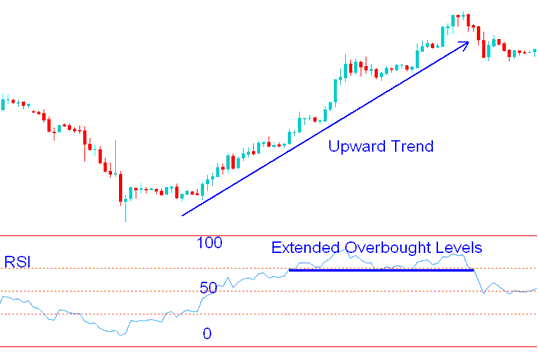
Over Extended Overbought and Oversold Levels
During periods of strong upward or downward market movement, the RSI index will linger in these overbought and oversold zones for extended durations. In such instances, merely looking to these overbought and oversold areas as indicators of market peaks or troughs becomes unreliable, as the RSI remains at these technical levels for a prolonged time. This is why we assert that the overbought and oversold regions are susceptible to whipsaws, making it advisable to validate these trading signals by employing the RSI centerline crossover methodology.
Over Extended Overbought and Oversold Levels - RSI Strategy
Get More Courses & Tutorials at:
- ROC, Rate of Change Analysis in Forex Trading
- Head and Shoulders and Reverse/Inverse Head and Shoulders XAU/USD Patterns
- Trading Signals Generated by the Accumulation/Distribution Indicator in MetaTrader 4
- How to Use MetaTrader 4 DeMarks Projected Range Indicator
- How Can I Use MetaTrader 4 Recursive Moving Trend Average Trading Indicator on MT4 Software/Platform?