Technical analysis and signals associated with Recursive Moving Trend Average
This Trading Technical Indicator is calculated using a mathematical polynomial fit, the formula is referred to as a Recursive Moving Polynomial Fit.
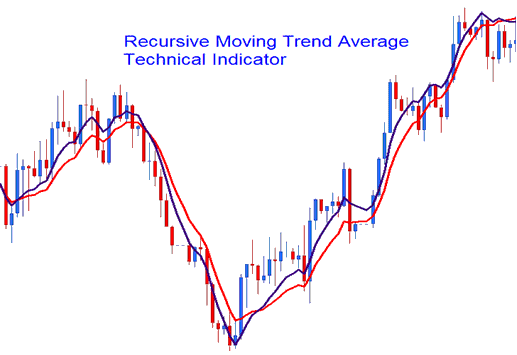
This formula for the indicator needs just a few past data points to figure out the next price direction. The example below shows two recursive averages joined to form a crossover trading system.
FX Technical Analysis and How to Generate Trading Signals
The crossover trading strategy, which allows you to combine two recursive averages, such as the 14 and 21, is the most effective way to perform technical analysis. A bullish indication is when the two cross over each other in an upward direction, while a bearish sign is when the two cross over in a downward direction.

Buy Sell Trade Signal
The Recursive Average acts a lot like the standard Moving Average. It stands out by being smoother from its math method and less likely to trigger false signals.
More Lessons:
- FX SMI 20 Forex Stock Index SMI 20 Symbol in Forex
- How to Trade the Nasdaq 100 Indices
- Aroon XAU USD Indicator Technical Analysis on XAU USD Charts
- Forex Trader Class: Beginner Trader Learning to Study Now
- Indices Trends and Index Market Trend Reversal Signal
- SMI20 Trade Strategy Guide Tutorial Download
- DJ 30 in MetaTrader 4 Defined
- How Do I Trade Tutorial Course to Trade Nasdaq 100 Strategies?
- How Can I Calculate Pips Value Hang Seng 50?
- Bollinger Band Trading Indicator Settings on MT4 Trade Platform