Where Should I Place a Stop-Loss Stocks Order using Bollinger Bands Stock Indicator?
Determining Where Should You Place a StopLoss Stocks Order using Bollinger Bands Stocks Indicator?
Bollinger Bands Indicator
Bollinger bands stocks indicator use standard deviation technical indicator as a measure of price volatility. Since standard deviation technical indicator is a measure of volatility, the bands are self adjusting which mean they widen during the periods of higher volatility and contract during the periods of lower volatility.
Bollinger Band consist of Three bands designed to encompass the majority of a trading instruments stocks trading price action. The middle band is the one that forms a basis for the intermediate term trend, mostly it is a 20 day period simple moving average, which also serves as the base for calculating the upper band and lower band. The upper band's and the lower band's distance from the middle band is determined by price volatility.
Since these Bollinger bands are used to encompass the trading instrument stocks trading price action, the bands can be used by traders to set stop losses just around the area outside of these bands.
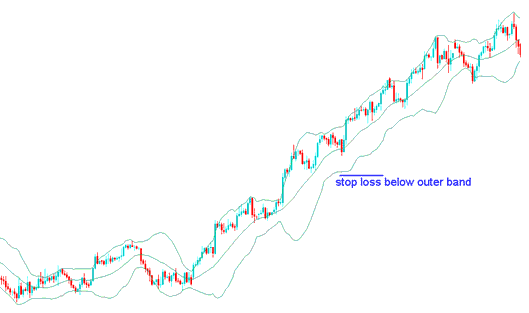
Where Should I place a Stop Loss Stocks Order using Bollinger Bands Stocks Indicator?


