Stock Fibonacci Retracement Strategy
What is Fib Stocks Strategy? Strategies for Stock Fibo Retracement Zones
Fibonacci retracement levels are horizontal lines are used to spot stocks price retracement levels in Stock Charts
Stock Fibonacci Retracement Strategy
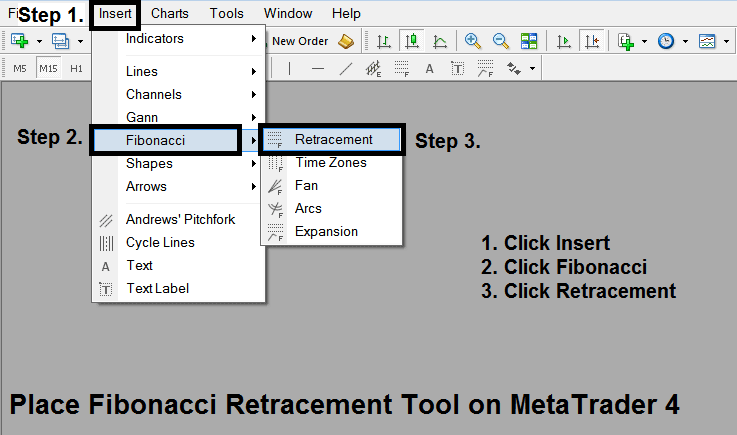
To Get Fibonacci Retracement Stock Indicator - Fibonacci Retracement Areas on the MT4 platform, you can use the following stocks step by step guide:
1. Click "Insert"2. Click "Fibonacci"3. Click "Retracement"
Stock Fibonacci Retracement Strategy - Stock Fibonacci Strategy - Fibonacci Retracement Stocks Strategy
Stock Fibonacci Retracement Strategy
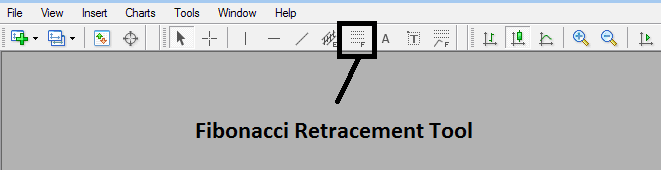
After adding Fib Retracement Stock Indicator - Fibonacci Retracement Areas on the MT4 platform - this Fibonacci retracement technical indicator can then be accessed from "MetaTrader 4 Line Studies Tool Bar" as shown on the stocks examples illustrated & described below.
Stock Fibonacci Retracement Strategy - Stock Fibonacci Strategy - Fibonacci Retracement Stocks Strategy
Stock Fibonacci Retracement Strategy
Stock Fibonacci Retracement technical indicator located on MT4 (Line Studies Tool-bar), to go to this line studies tool-bar click "View" button key at tops left corner of MT4 stock platform next to file, then click "Toolbars", Then Check "Line Studies".
From the above Stock Fibonacci Retracement Strategy - Stock Fibonacci Strategy - Fibonacci Retracement Stocks Strategy - a trader can then learn how to use this Stock Fibonacci Retracement indicator & place it on a stocks chart so as to determine where the Stock Fibonacci Retracement Areas are on the Stock Chart.


