What is a Stocks Retracement Strategy?
How Do I Use Trading Stocks Fibonacci in Stocks?
A good stocks retracement strategy to use is the fibonacci retracement indicator. Fibonacci retracement indicator is used by many traders as a stocks retracement strategy trading indicator tool.
The fibonacci retracement indicator is placed on a stocks chart and this Stock Fibonacci Retracement indicator then calculates the retracement levels on the stocks charts.
Stocks Fib Retracement Strategy Examples on Upward Stocks Trend & Downward Stock Trend
How to Trade Retracement on Upward Stocks Trend
In the Stocks Retracement Strategy example illustrated and explained below the stocks price is moving up between chart point 1 & chart point 2 then after chart point 2 it retraces down to 50.0% retracement level then stocks price continues moving up in the original upwards trend. Note that this retracement indicator is drawn from point 1 to point 2 in direction of the trend (Upwards Direction).
Because we know this is just a retracement based on our stocks chart stocks trend - using this retracement indicator, we put a buy order just between the levels 38.2% and 50.0% and our stoploss just below 61.8% pull back mark. If you had put buy at this point in the trade example illustrated and explained below you would have made a lot of pips after the price retracement reached the Fibonacci 50.0% level and then continued moving in the original upward trend.
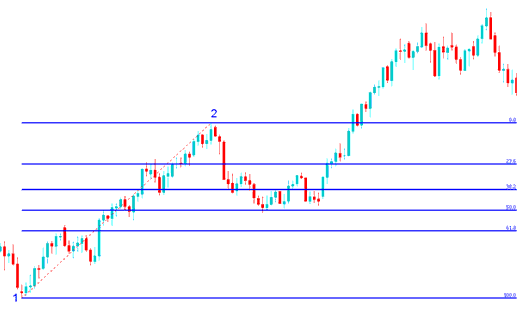
How to Trade Retracement on Upward Stocks Trend - Stocks Retracement Strategy
Explanation for the Above Stock Retracement Strategy Example
Once the stocks price hit the 50.0% retracement level, this retracement level provided a lot of support for stocks price, & afterward stocks market then resumed the original upwards trend and continued to move upward.
23.60% retracement level provides minimum support and is not an ideal place to set a stocks order.
38.20% retracement level provides some support but stocks price in this example continued to retrace upto the 50% zone.
50.00% retracement level provides a lot of support and in this example, this was the ideal place to set a buy stocks order.
For this Stocks Retracement Strategy example, the stocks price retracement reached the 50.0% retracement level, but most of the time the stocks market will retrace up to 38.2% retracement level and therefore most of the time stocks traders set their buy limit orders at the 38.2% Fibo retracement level, while at the same time placing a stop just below 61.8% Fibo retracement level.
How to Trade Retracement on Downwards Stocks Trend
In the Stocks Retracement Strategy example illustrated and explained below the stocks market is moving downwards between chart point 1 & chart point 2, then after chart point 2 the stocks price then retraces up to 38.2% retracement level then it continues moving downwards in the original downwards trend. Note that this retracement indicator is drawn from point 1 to point 2 in direction of the trend (Downwards Direction).
Because we know this is just a retracement based on the stock chart stocks trend we put a sell order at 38.2% retracement level and a stop loss just above 61.8% retracement level.
If you had put sell order at the 38.2% retracement level as shown on the trade below you would have made a lot of pips afterwards after the price reached the 38.2% retracement level and then resumed the downward stock trend.
In this trade the retracement of stocks price reached 38.20% retracement level & did not get to 50.00% retracement level. It is always good to use 38.20% retracement level because most times the stocks price retracement doesn't always get to 50.0% retracement level.
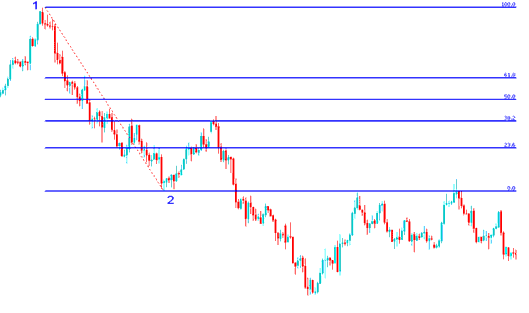
How to Trade Retracement on Downwards Stocks Trend - Stocks Retracement Strategy
Explanation for the Above Stock Retracement Strategy Example
The above Stocks Retracement Strategy example is a stocks retracement trading set up where the price retraces immediately after touching the 38.2% Stock Fibonacci Retracement Level.
This Stocks Retracement level provided a lot of resistance for the stocks price retracement, this was the best place for a trader to set a sell limit pending order as a stocks market quickly moved down after hitting this retracement level.


